Coffeeshop Site Selection Using Geospatial Analysis
A Simple Methodology Combining ArcGIS Pro Tools and Python Data Scraping
View the complete academic paper with detailed methodology and references
📄 Download Full Paper (PDF)Project Overview: This analysis demonstrates a cost-effective methodology for optimizing business location selection using geospatial analysis, demographic data, and market gap identification. The approach combines ArcGIS Pro's spatial analysis capabilities with Python web scraping to identify optimal coffeeshop locations in the Saint Louis region.
Business Challenge
Our successful coffeeshop needed to select an additional location to grow the business with three key goals:
- Increase profit and revenue through strategic location selection
- Expand brand presence in underserved markets
- Community-building by creating diverse, welcoming social environments
Traditional site selection relies on intuition or expensive consulting services. This project demonstrates how geospatial analysis can provide data-driven location decisions with minimal cost.
Methodology & Tools Used
ArcGIS Pro
Spatial analysis, service area calculation, demographic overlay
Python
Yelp API scraping, data processing, competitor mapping
Census Data
Demographics, spending patterns, age distribution analysis
Market Analysis
Gap identification, service area modeling, site optimization
Analytical Approach
- Competitor Mapping: Python scraping of Yelp API to identify all independent coffeeshops
- Service Area Analysis: 5-minute drive-time calculations using ArcGIS Pro
- Demographic Overlay: Census block-level age and spending data integration
- Gap Analysis: Market saturation mapping and opportunity identification
- Site Evaluation: Quantitative comparison of potential locations
Data Collection & Processing
The analysis began with comprehensive competitor mapping using Python to scrape the Yelp API, identifying every independent coffeeshop within a 50-mile radius of Saint Louis. This provided real-time business location data that traditional datasets lack.
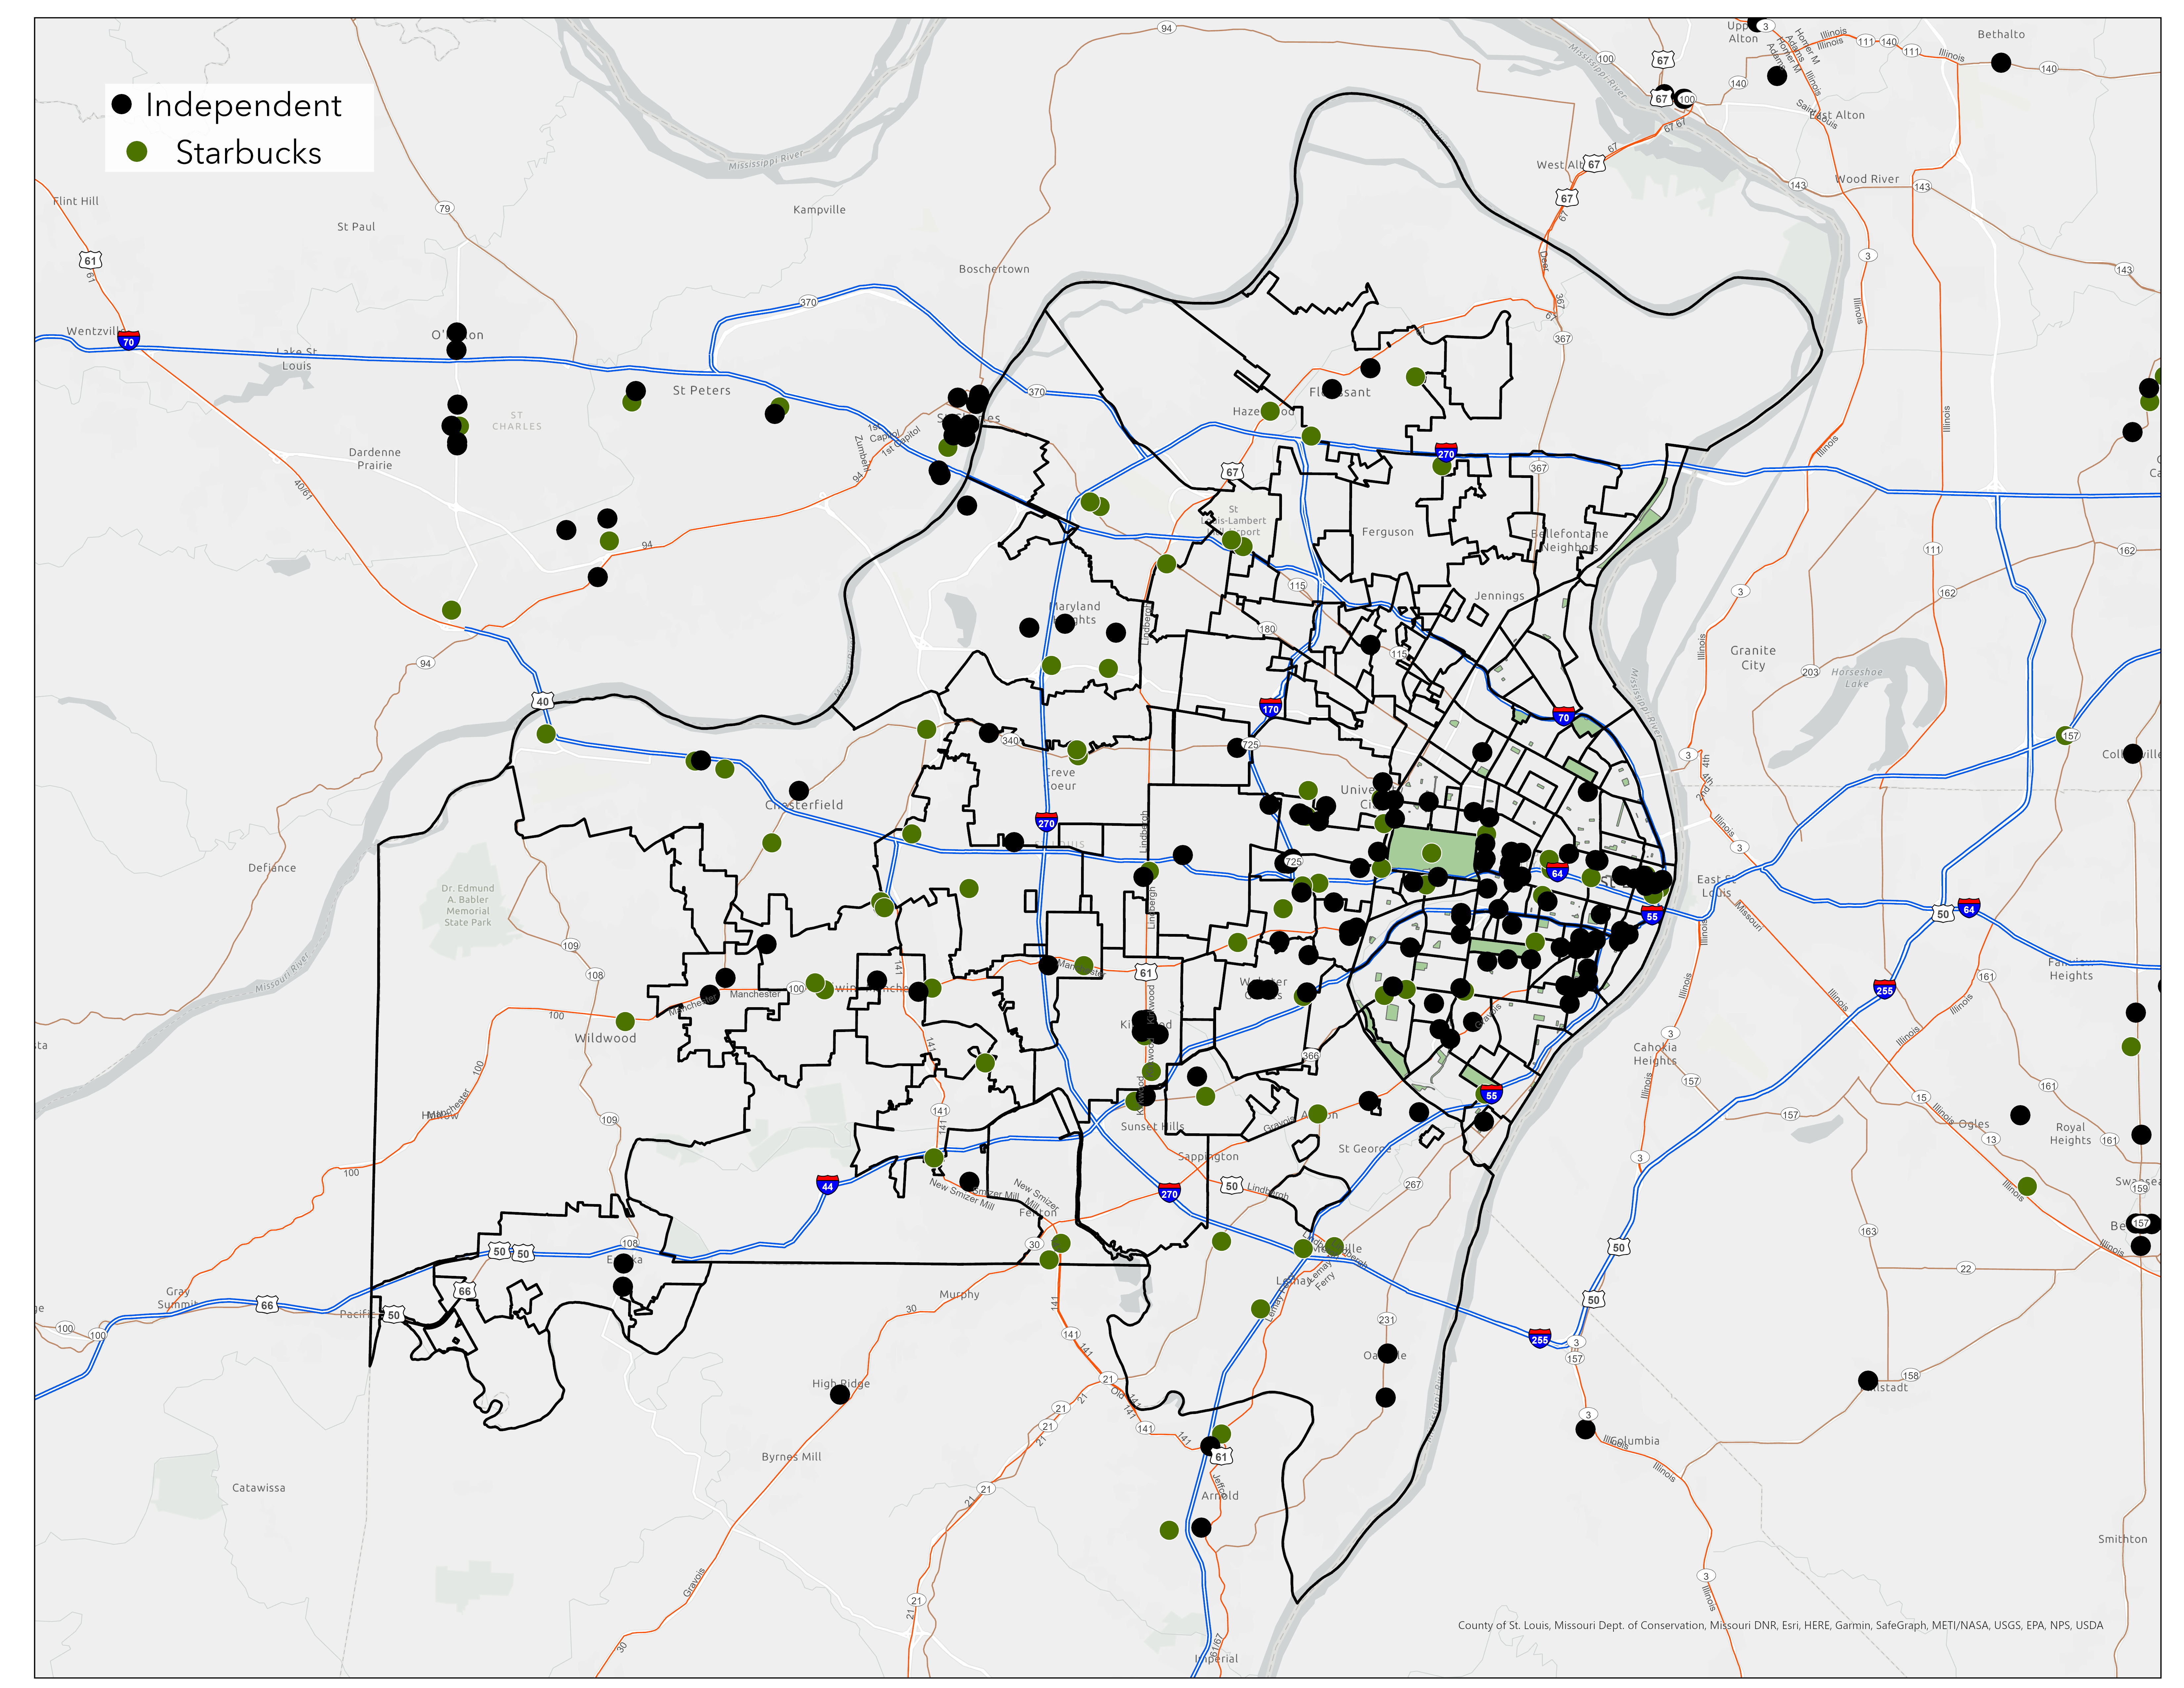
Figure 1: Locations of Independent Coffeeshops in the Saint Louis Region
Demographic Data Integration
Using ArcGIS Pro's enrich feature, we integrated Census block group data focusing on two key demographic variables:
- Median Age: Target demographic of 35-40 years (observed customer base median)
- Breakfast-Out Spending: Normalized by area to create spending density measures
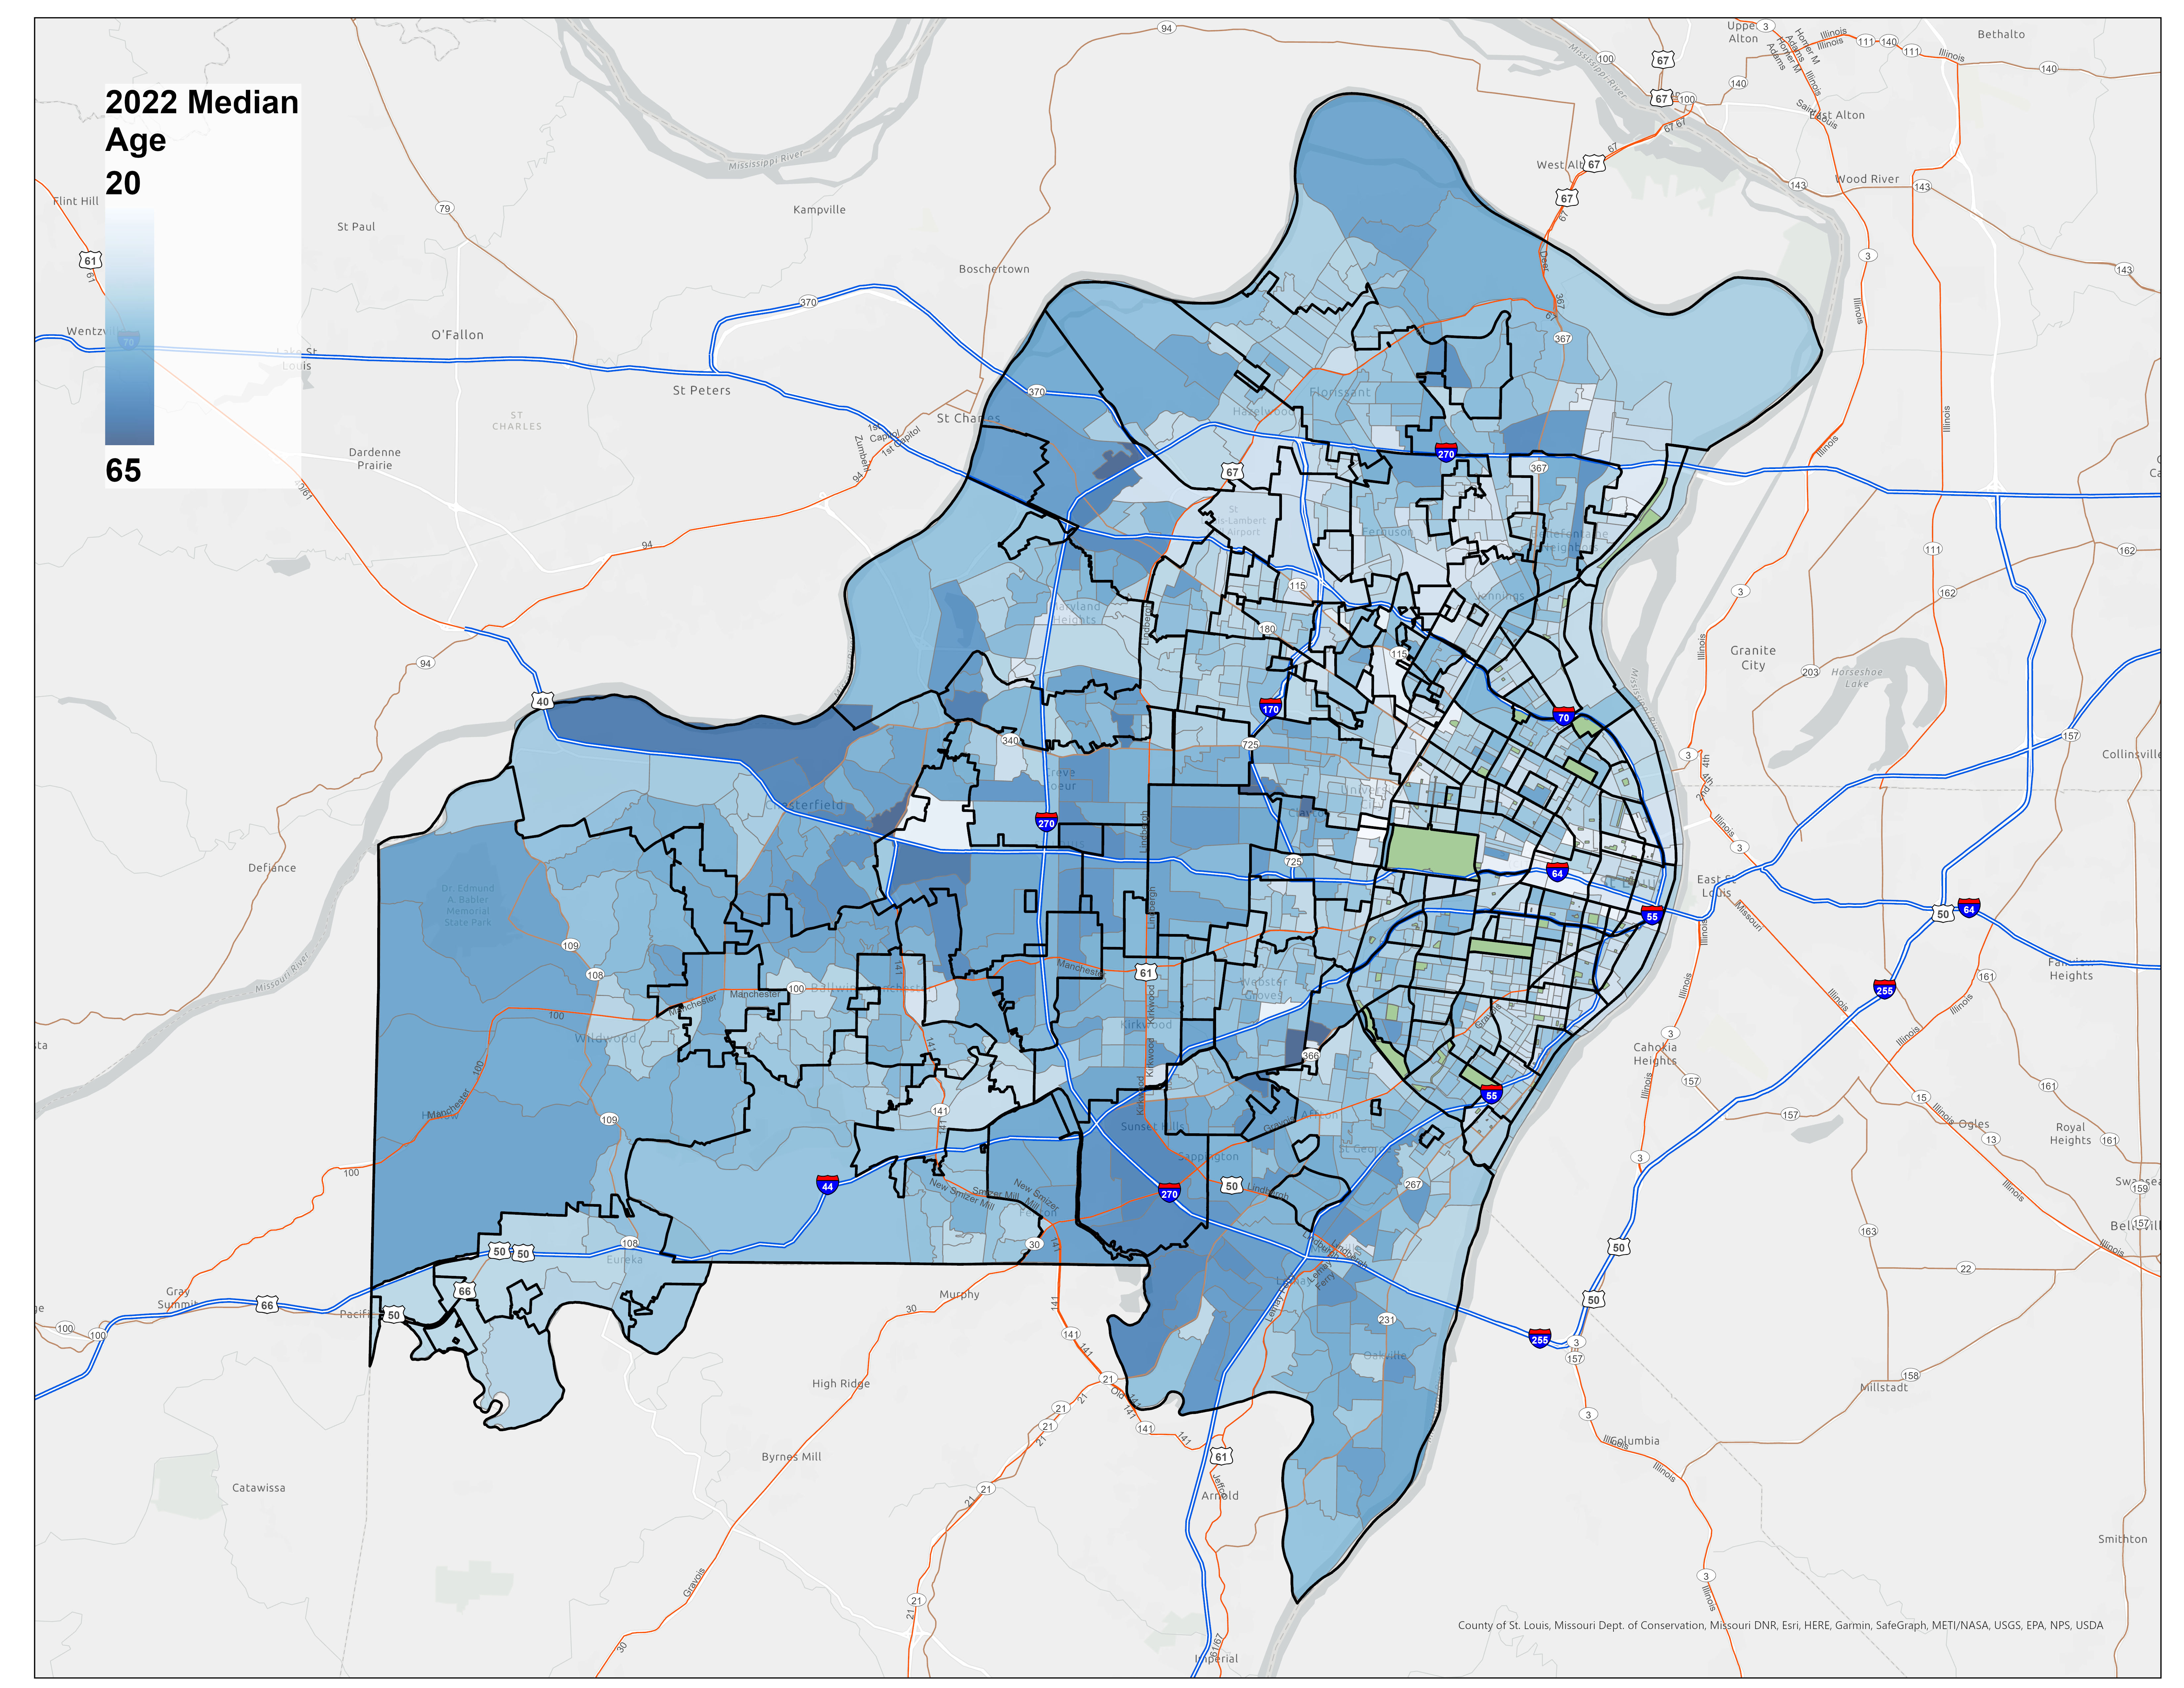
Figure 2: Median Age Within Census Block Groups
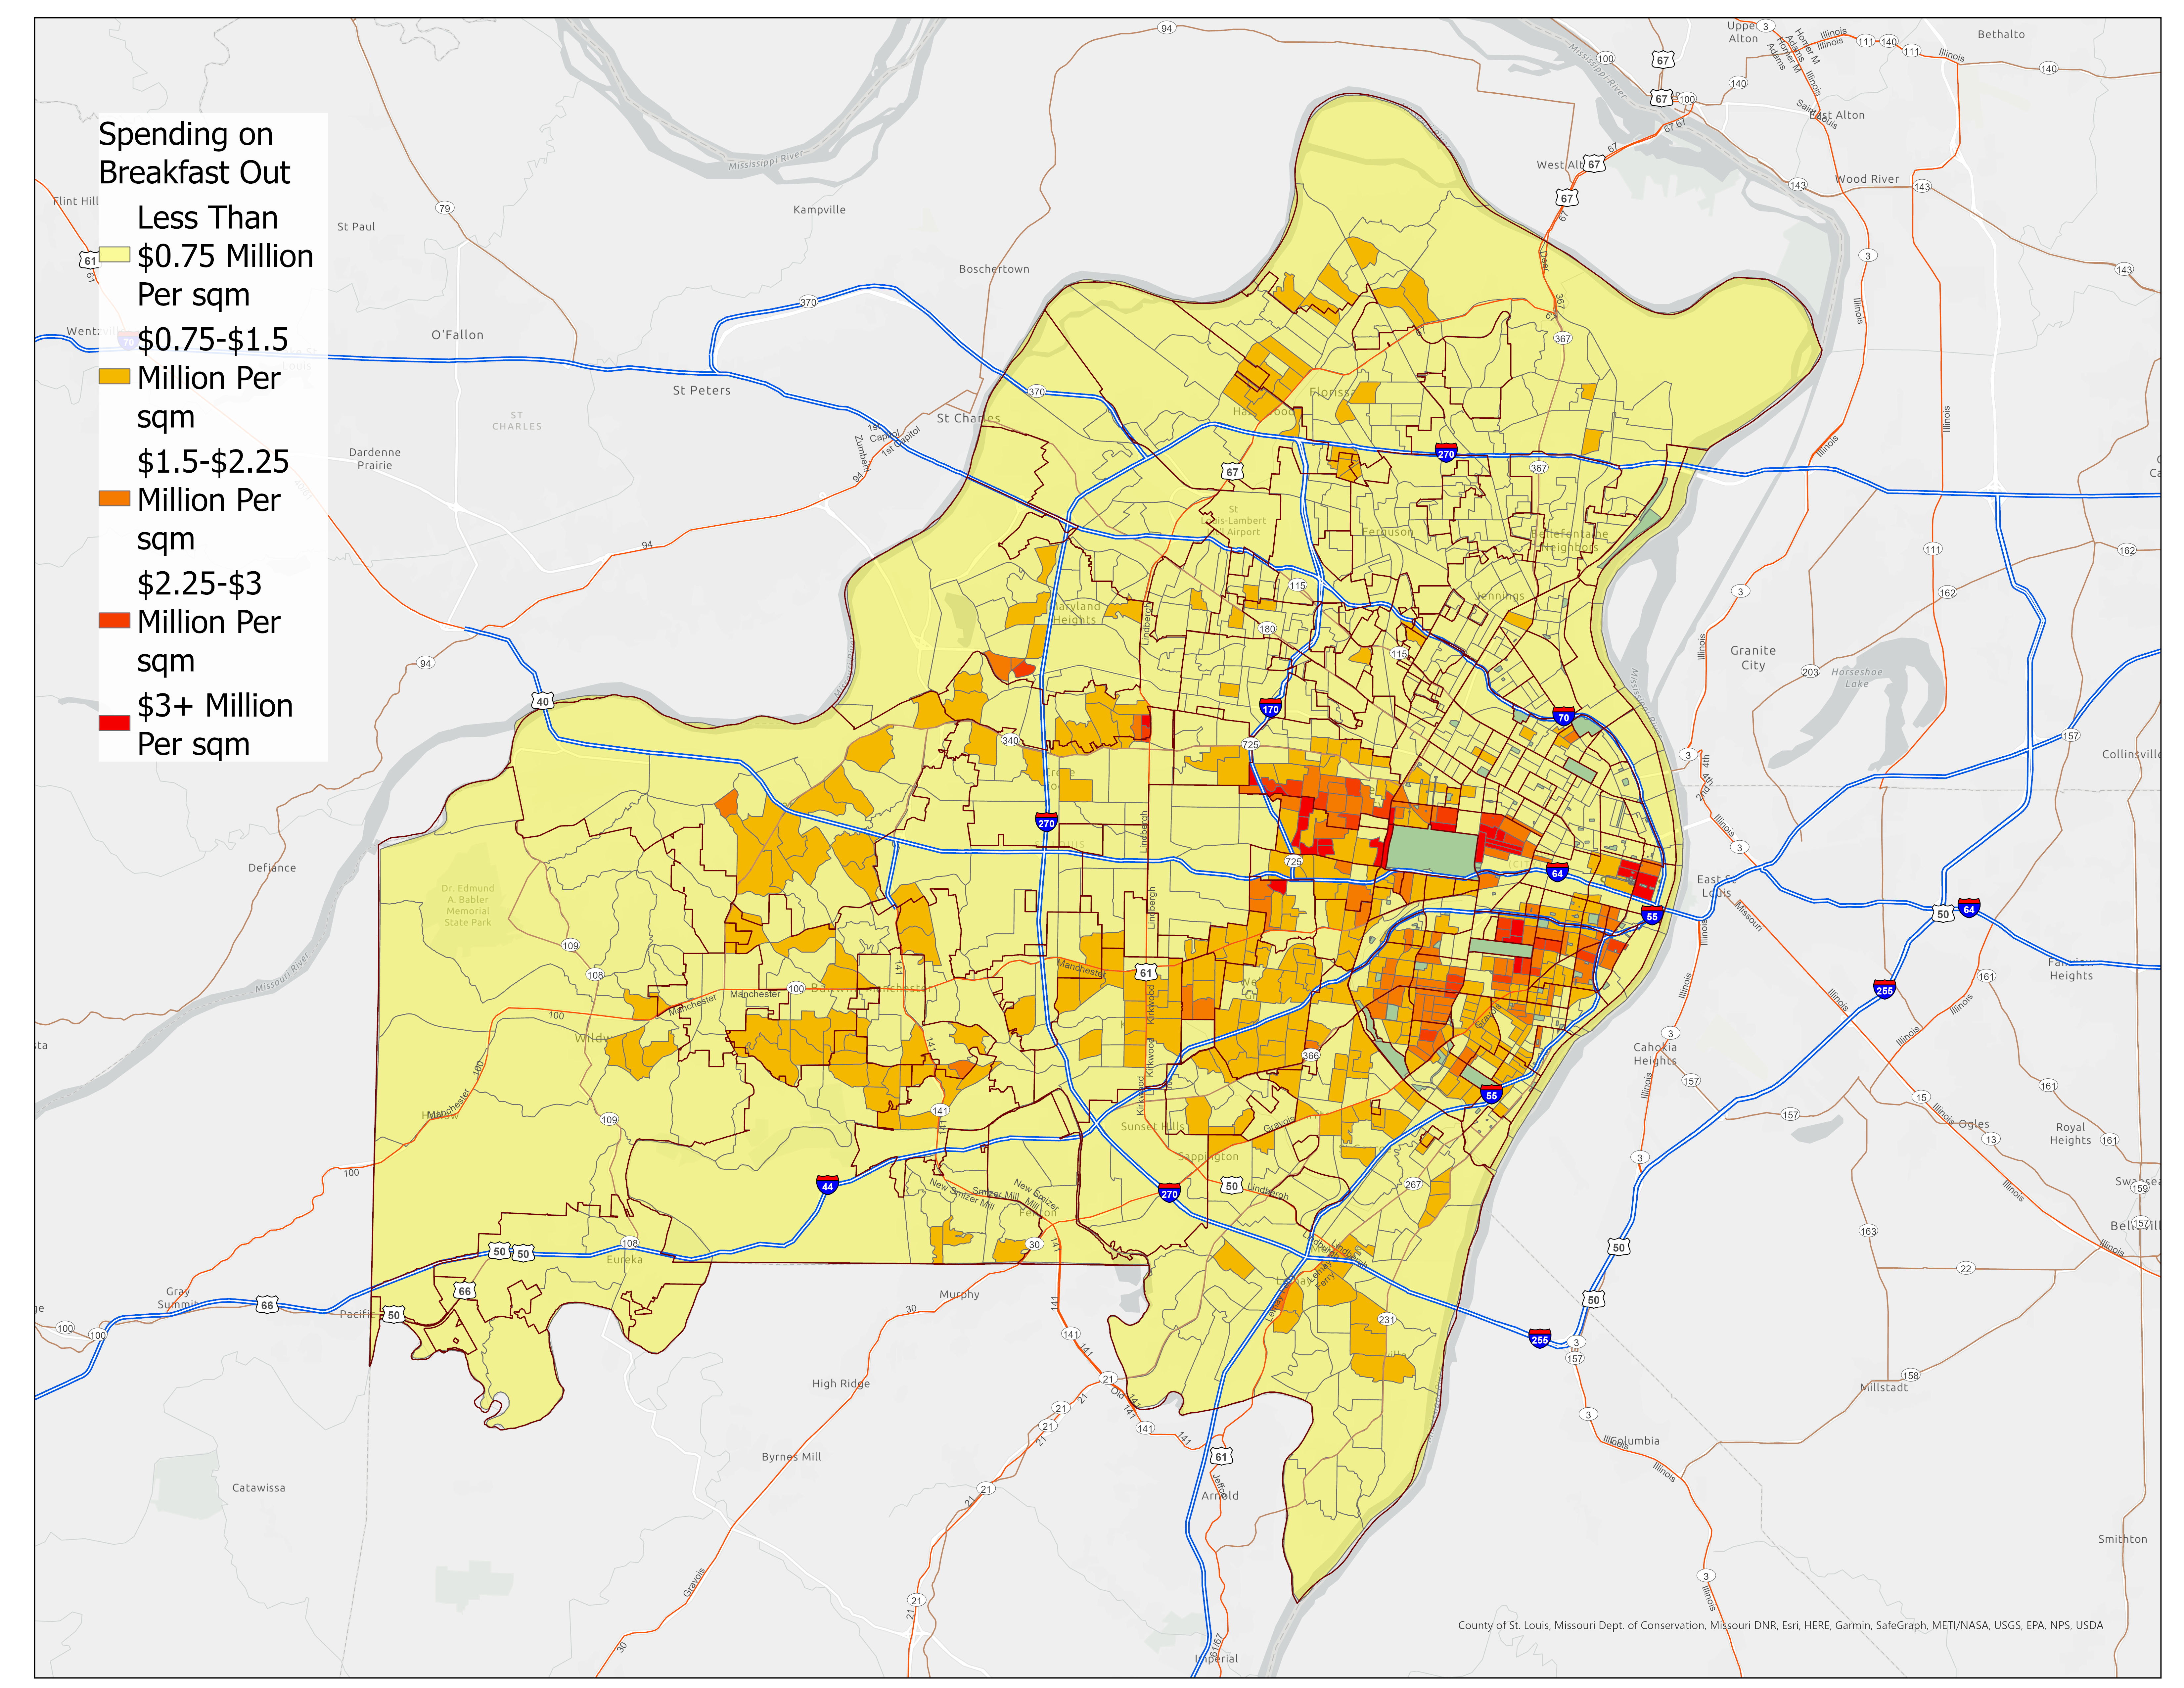
Figure 3: Spending on Breakfast-Out Per Square Mile Within Census Block Groups
Spatial Analysis Process
Service Area Modeling
Based on consumer research showing customers travel no more than 6 minutes for regular small purchases, we defined service areas using 5-minute drive-time radii. This accounts for Saint Louis's car-dependent transportation patterns.
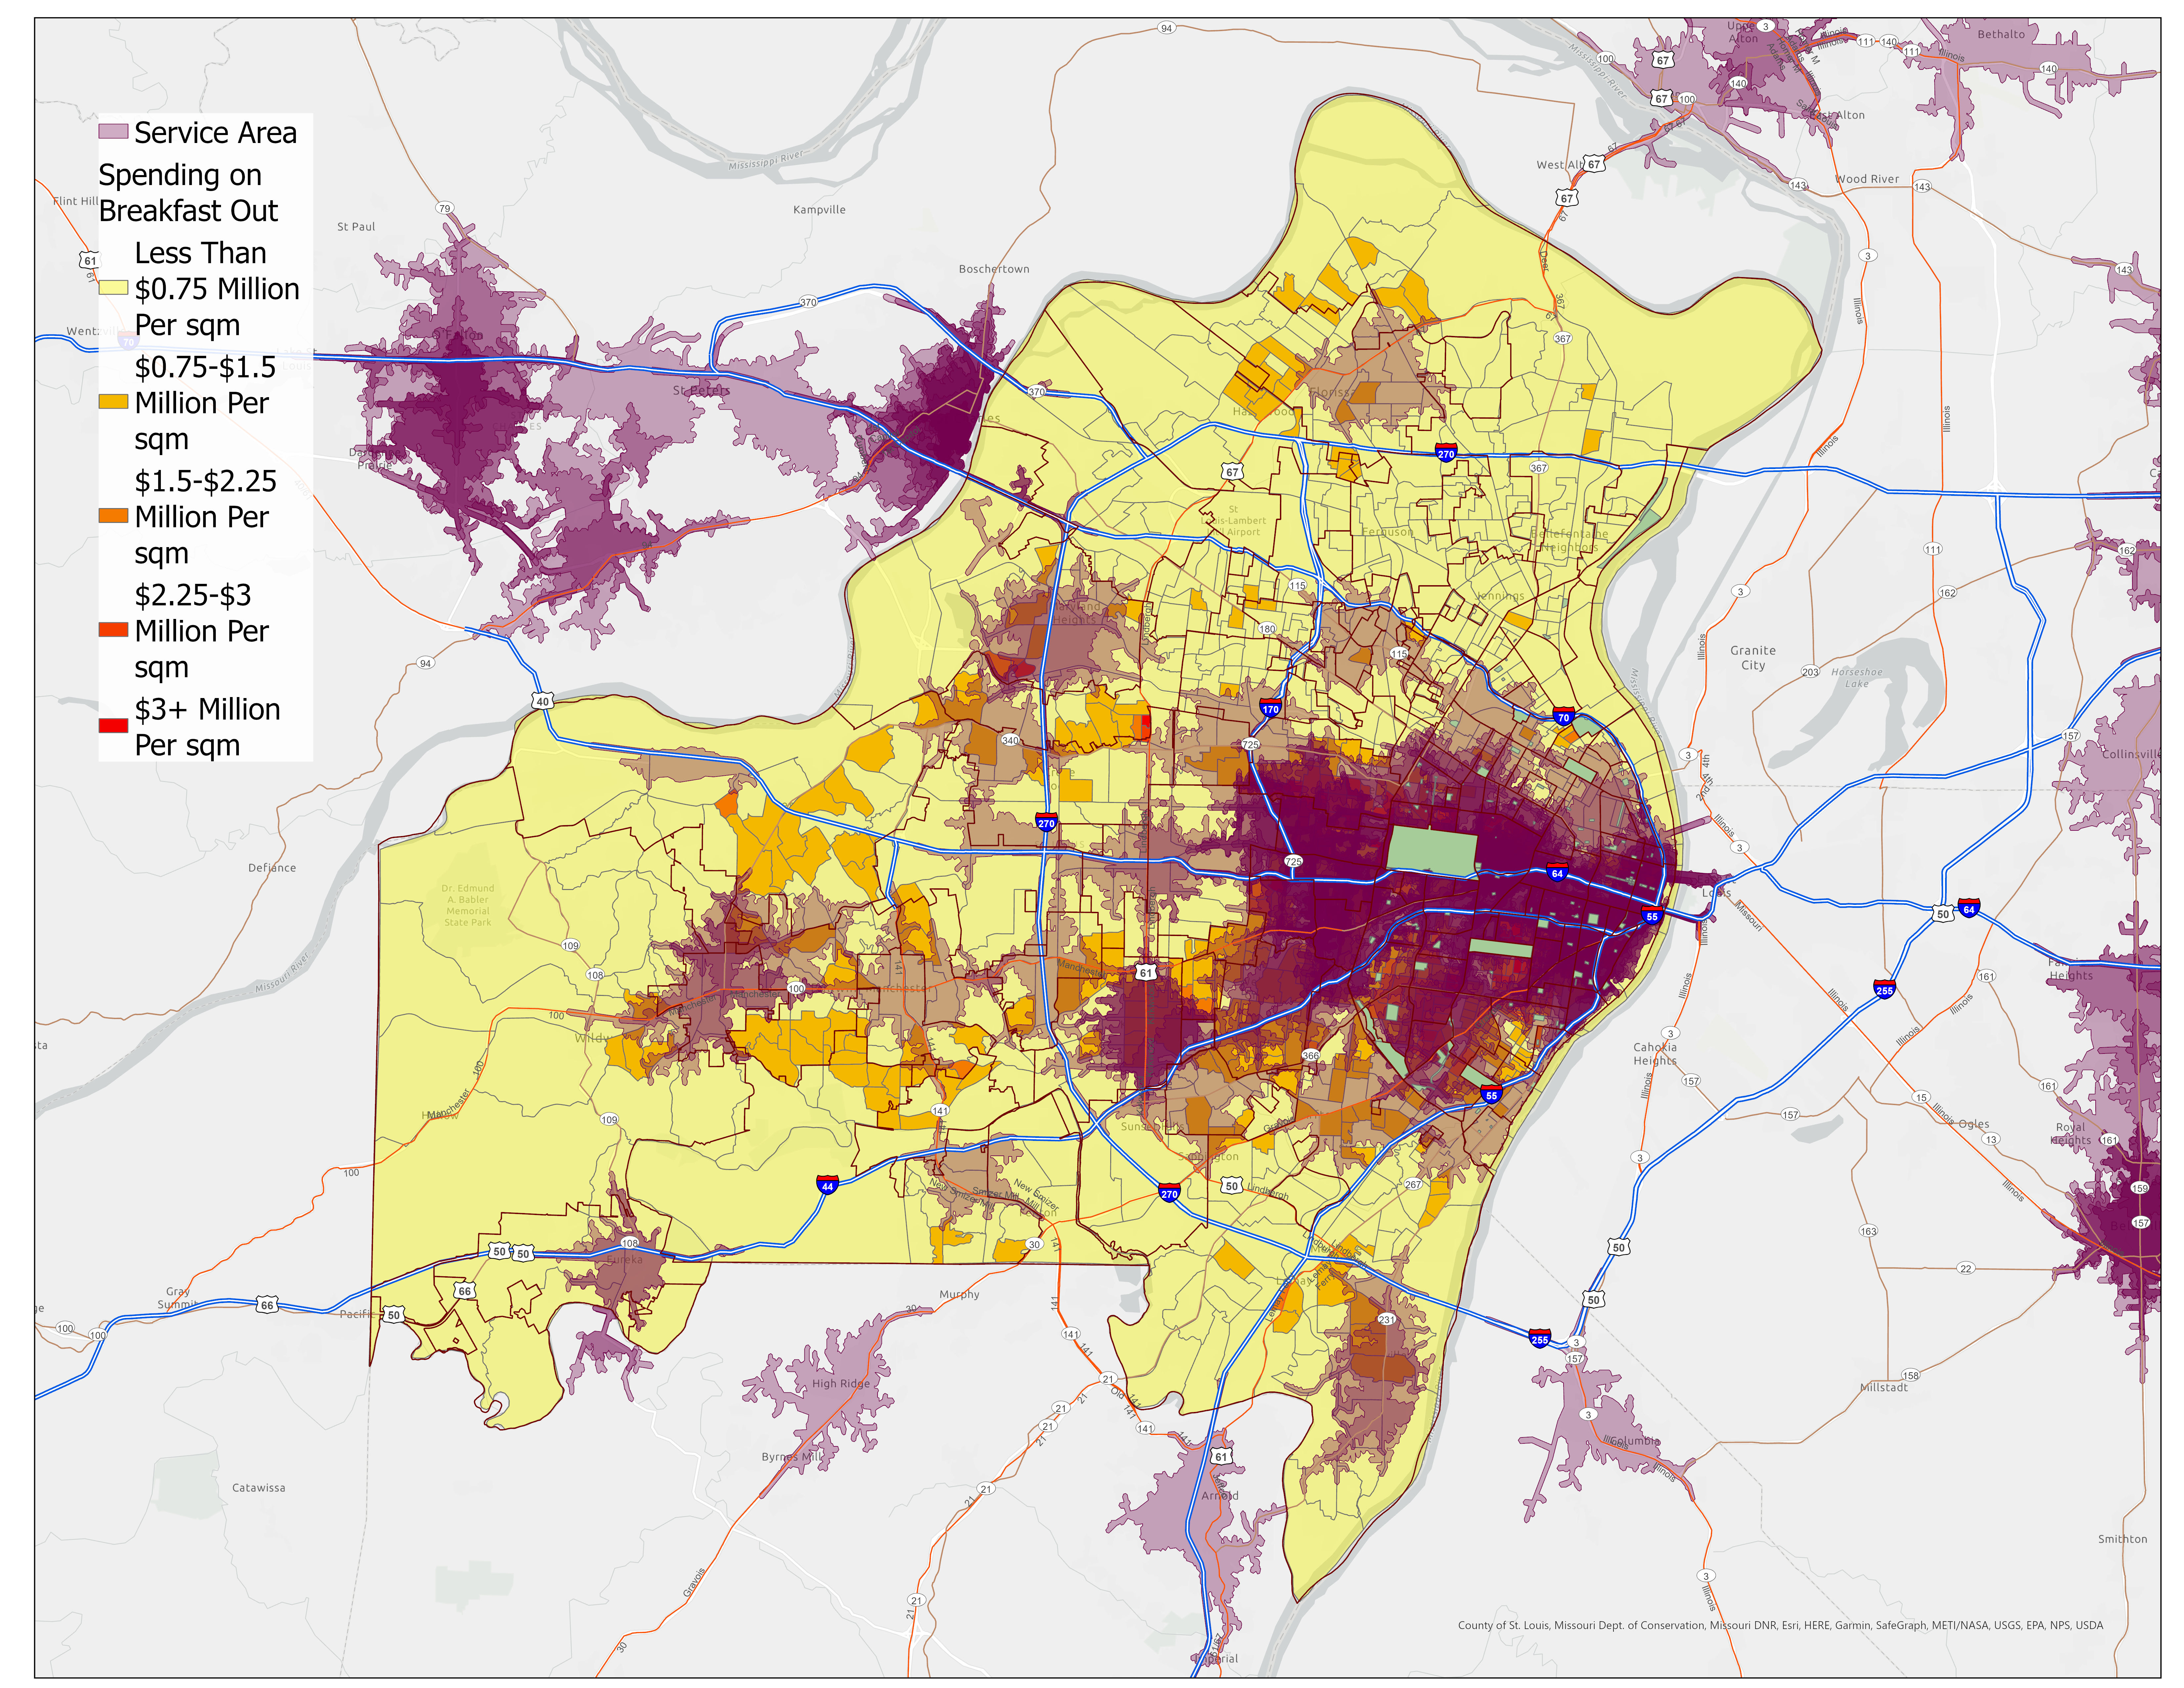
Figure 4: Independent Coffeeshop Market Coverage Overlaid on Breakfast-Out Expenses
Market Saturation Analysis
Using ArcGIS Pro's Count Overlapping Features tool, we identified market saturation levels and gaps in service coverage, revealing clear opportunities for new locations.
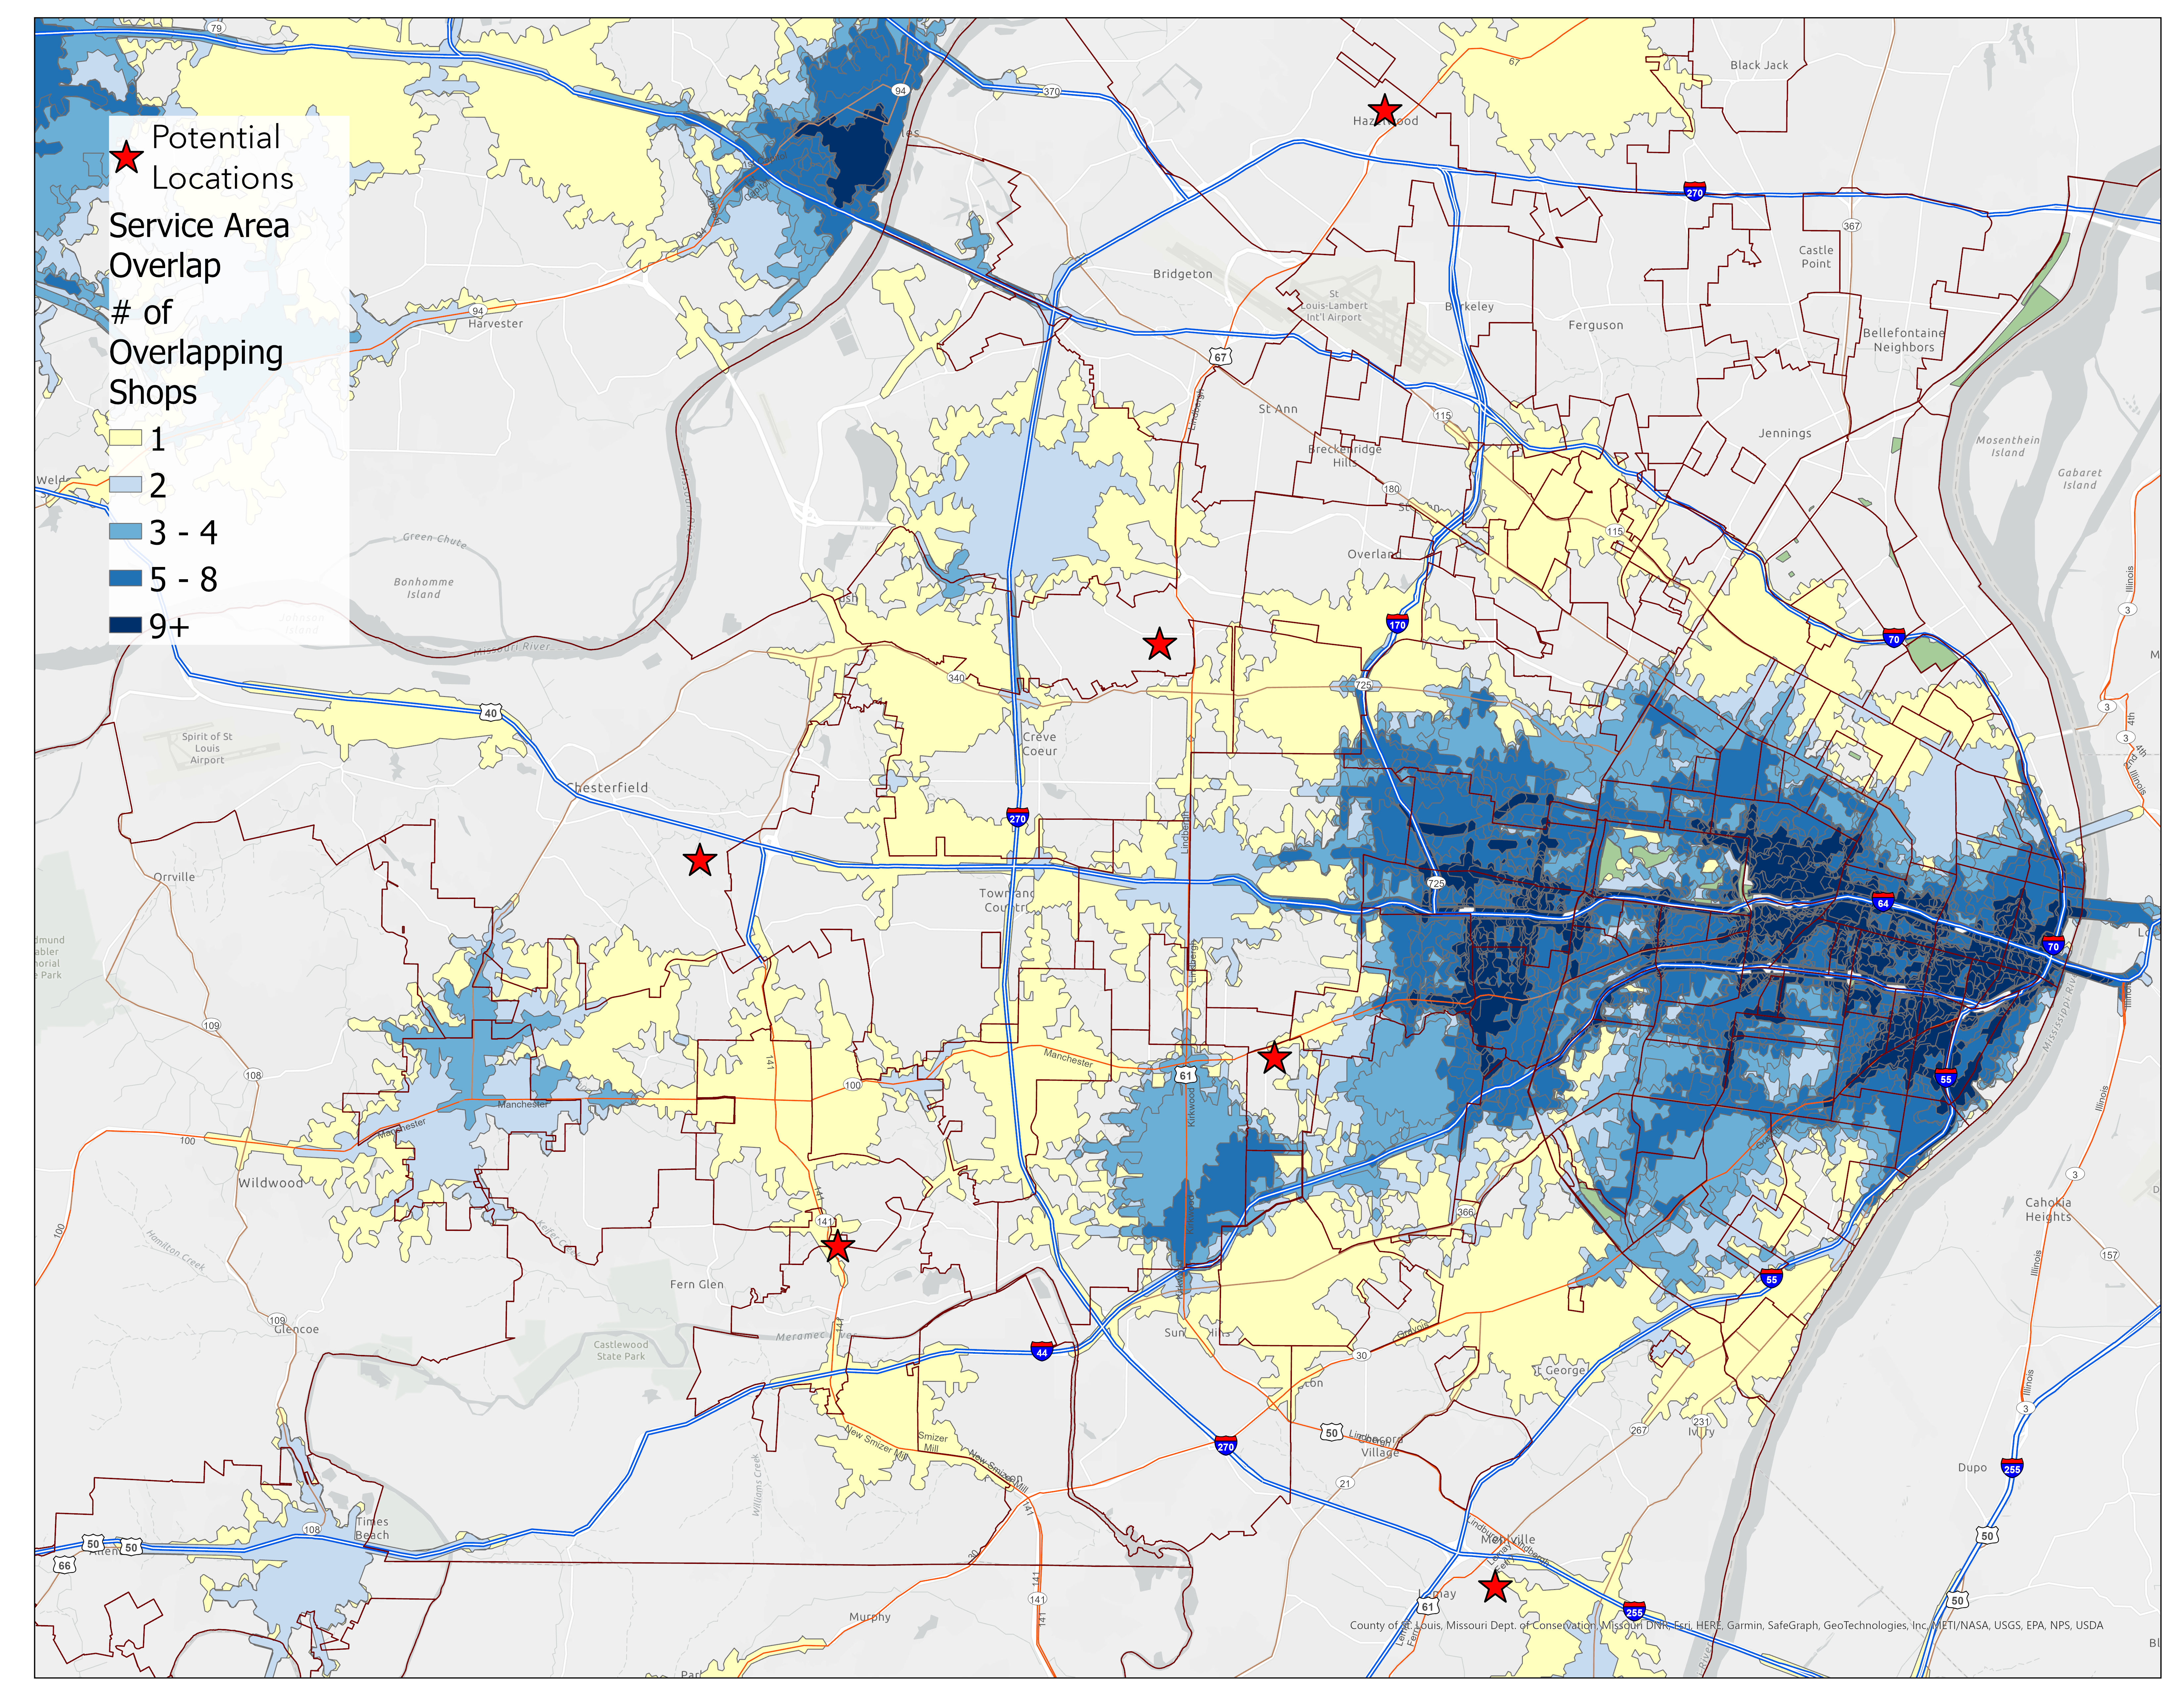
Figure 5: Independent Coffeeshop Market Saturation Overlaid on Breakfast-Out Expenses
Site Selection & Results
Six potential sites were identified through visual inspection of areas with:
- High breakfast-out spending density
- Target age demographics (35-40 years median)
- Service gaps in competitor coverage
- Good thoroughfare access for visibility
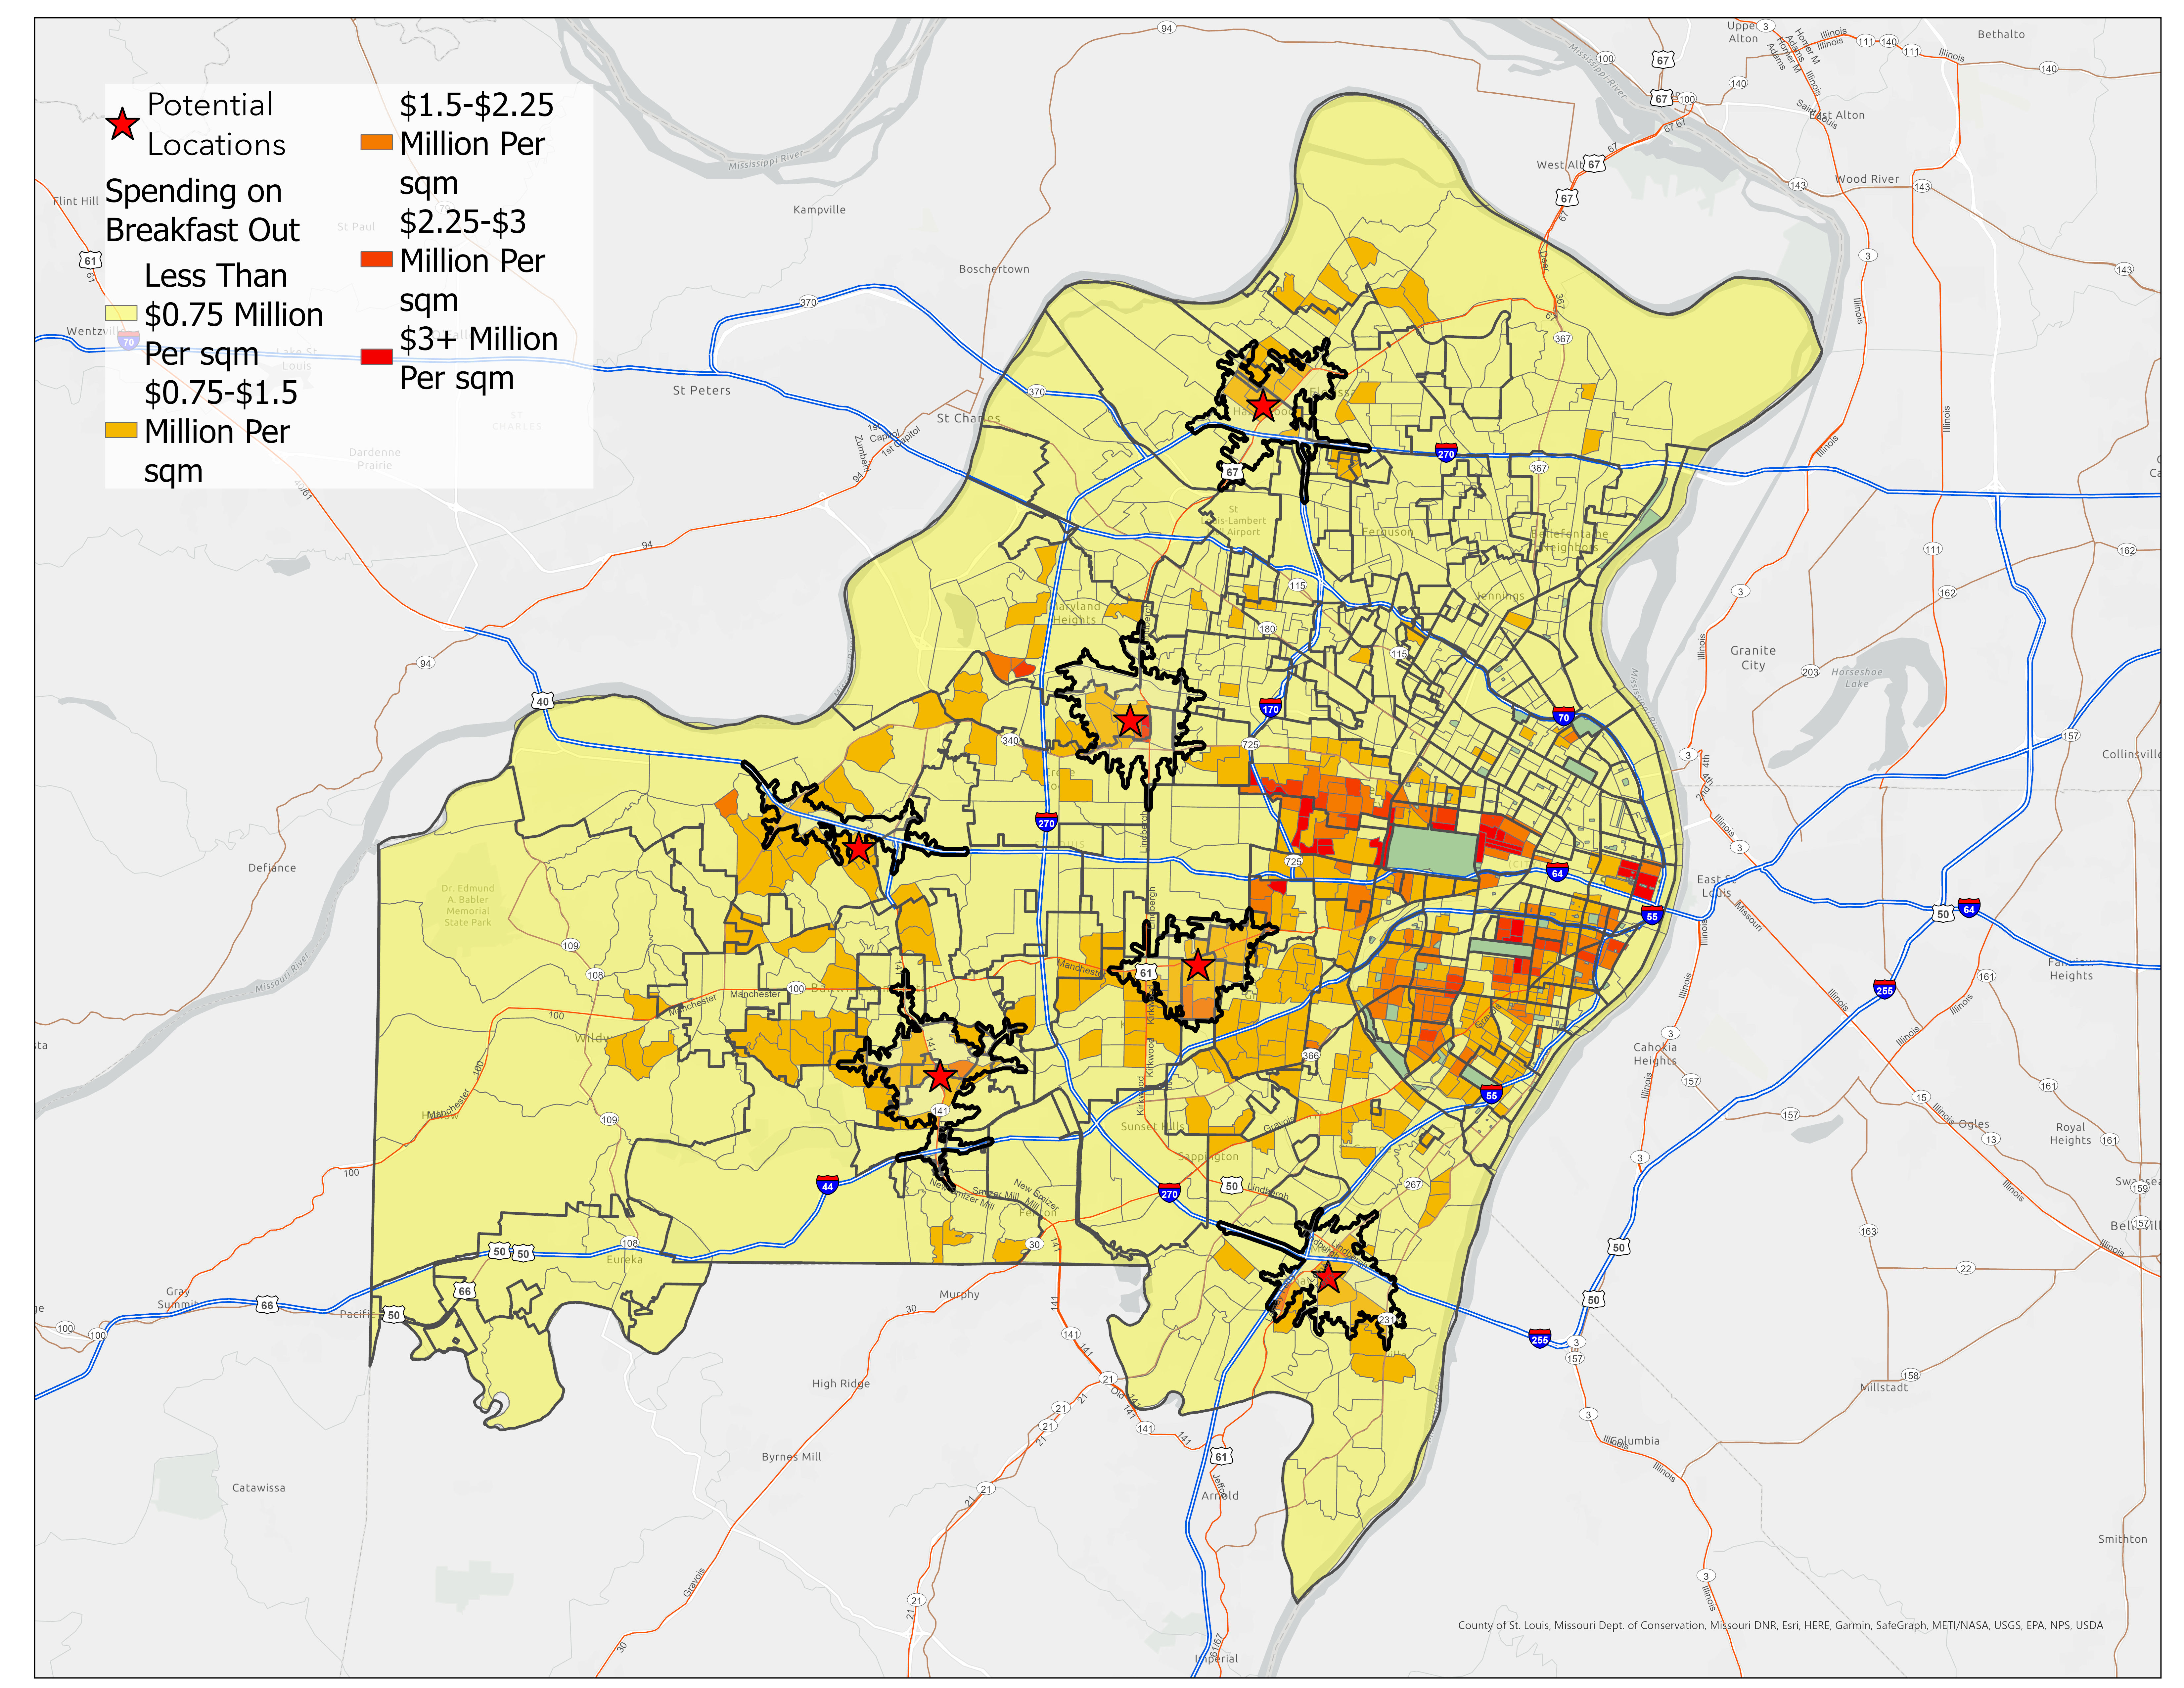
Figure 6: Service Areas of Potential Sites Over Breakfast-Out Spending
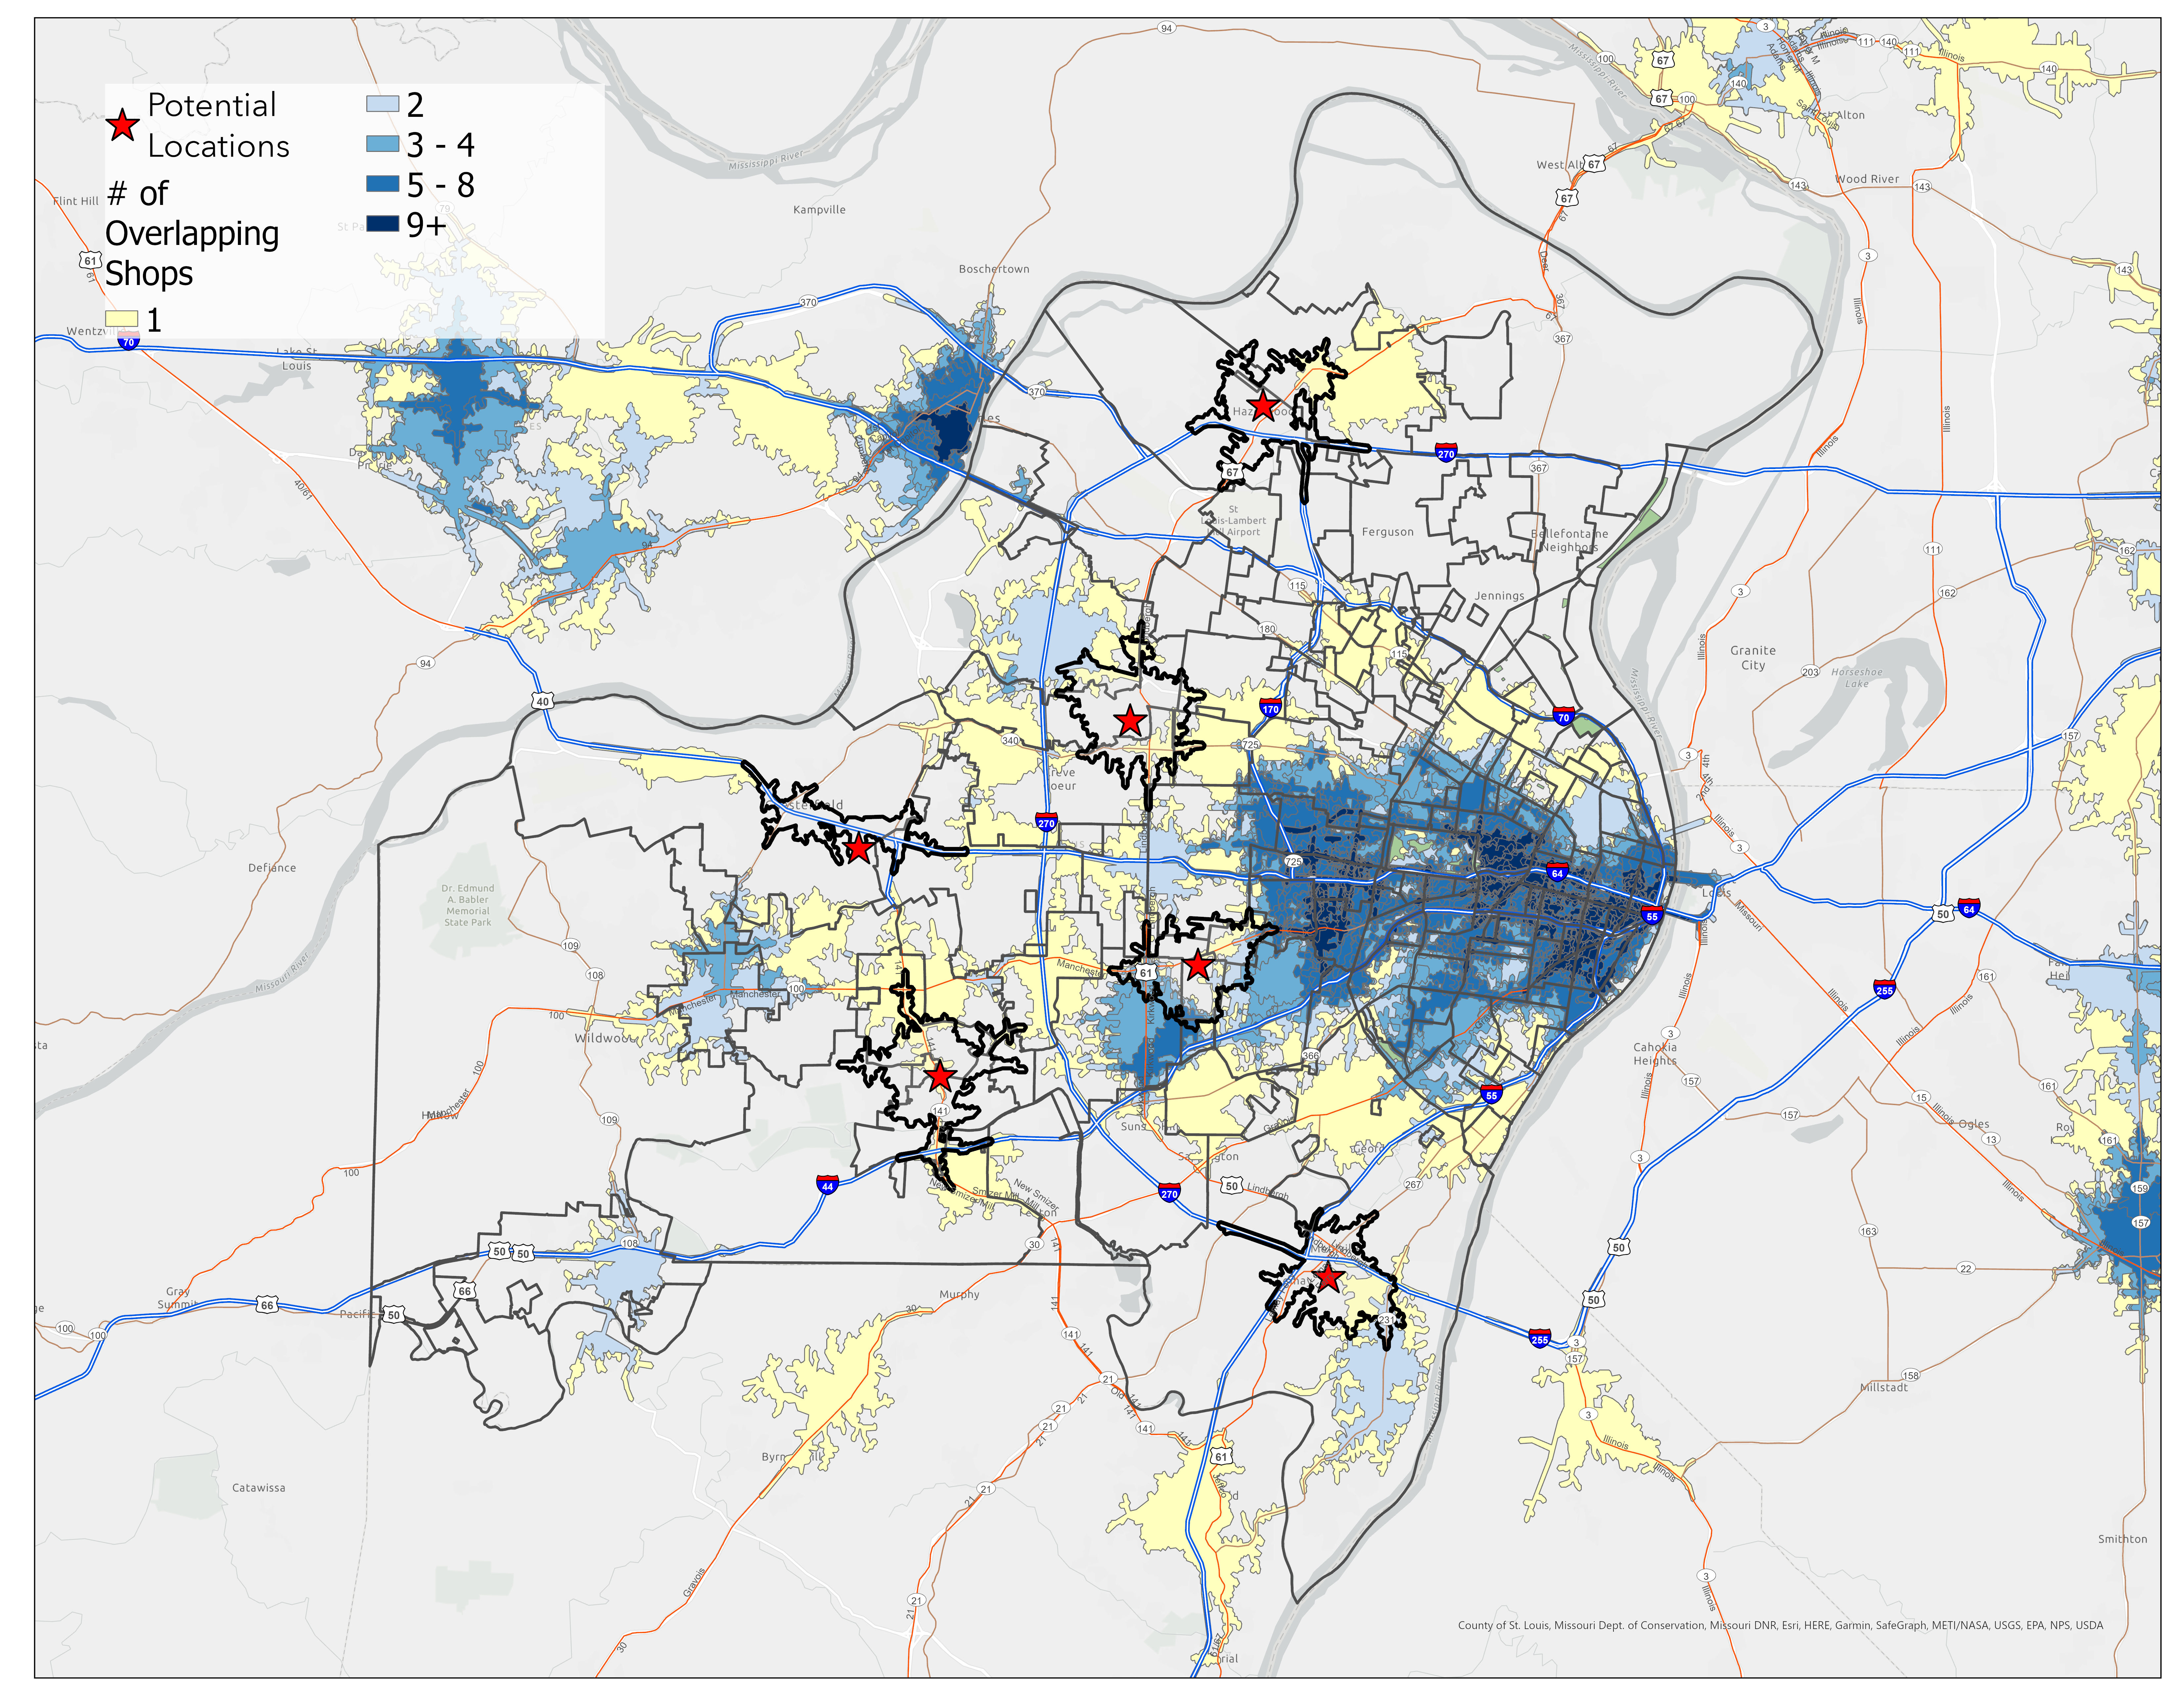
Figure 7: Service Areas of Potential Sites Against Competitor Service Areas
Quantitative Site Comparison
Using ArcGIS Pro's enrich tool on the potential service areas, we calculated precise demographic and market values for each site:
| Site Location | Median Age | Breakfast-Out Spending | Market Assessment |
|---|---|---|---|
| Warson Woods | 43 | $4,990,433 | Clear front-runner with highest market potential |
| Valley Park | 40 | $3,690,201 | Ideal age demographic, strong market value |
| Creve Coeur | 46 | $3,128,031 | Good market size, slightly older demographic |
| Mehlville | 43 | $2,825,672 | Moderate potential |
| Florissant | 39 | $2,501,145 | Excellent age match, moderate spending |
| Chesterfield | 54 | $1,008,338 | Demographics too old for target market |

Figure 8: Median Age Within Potential Site Market Areas
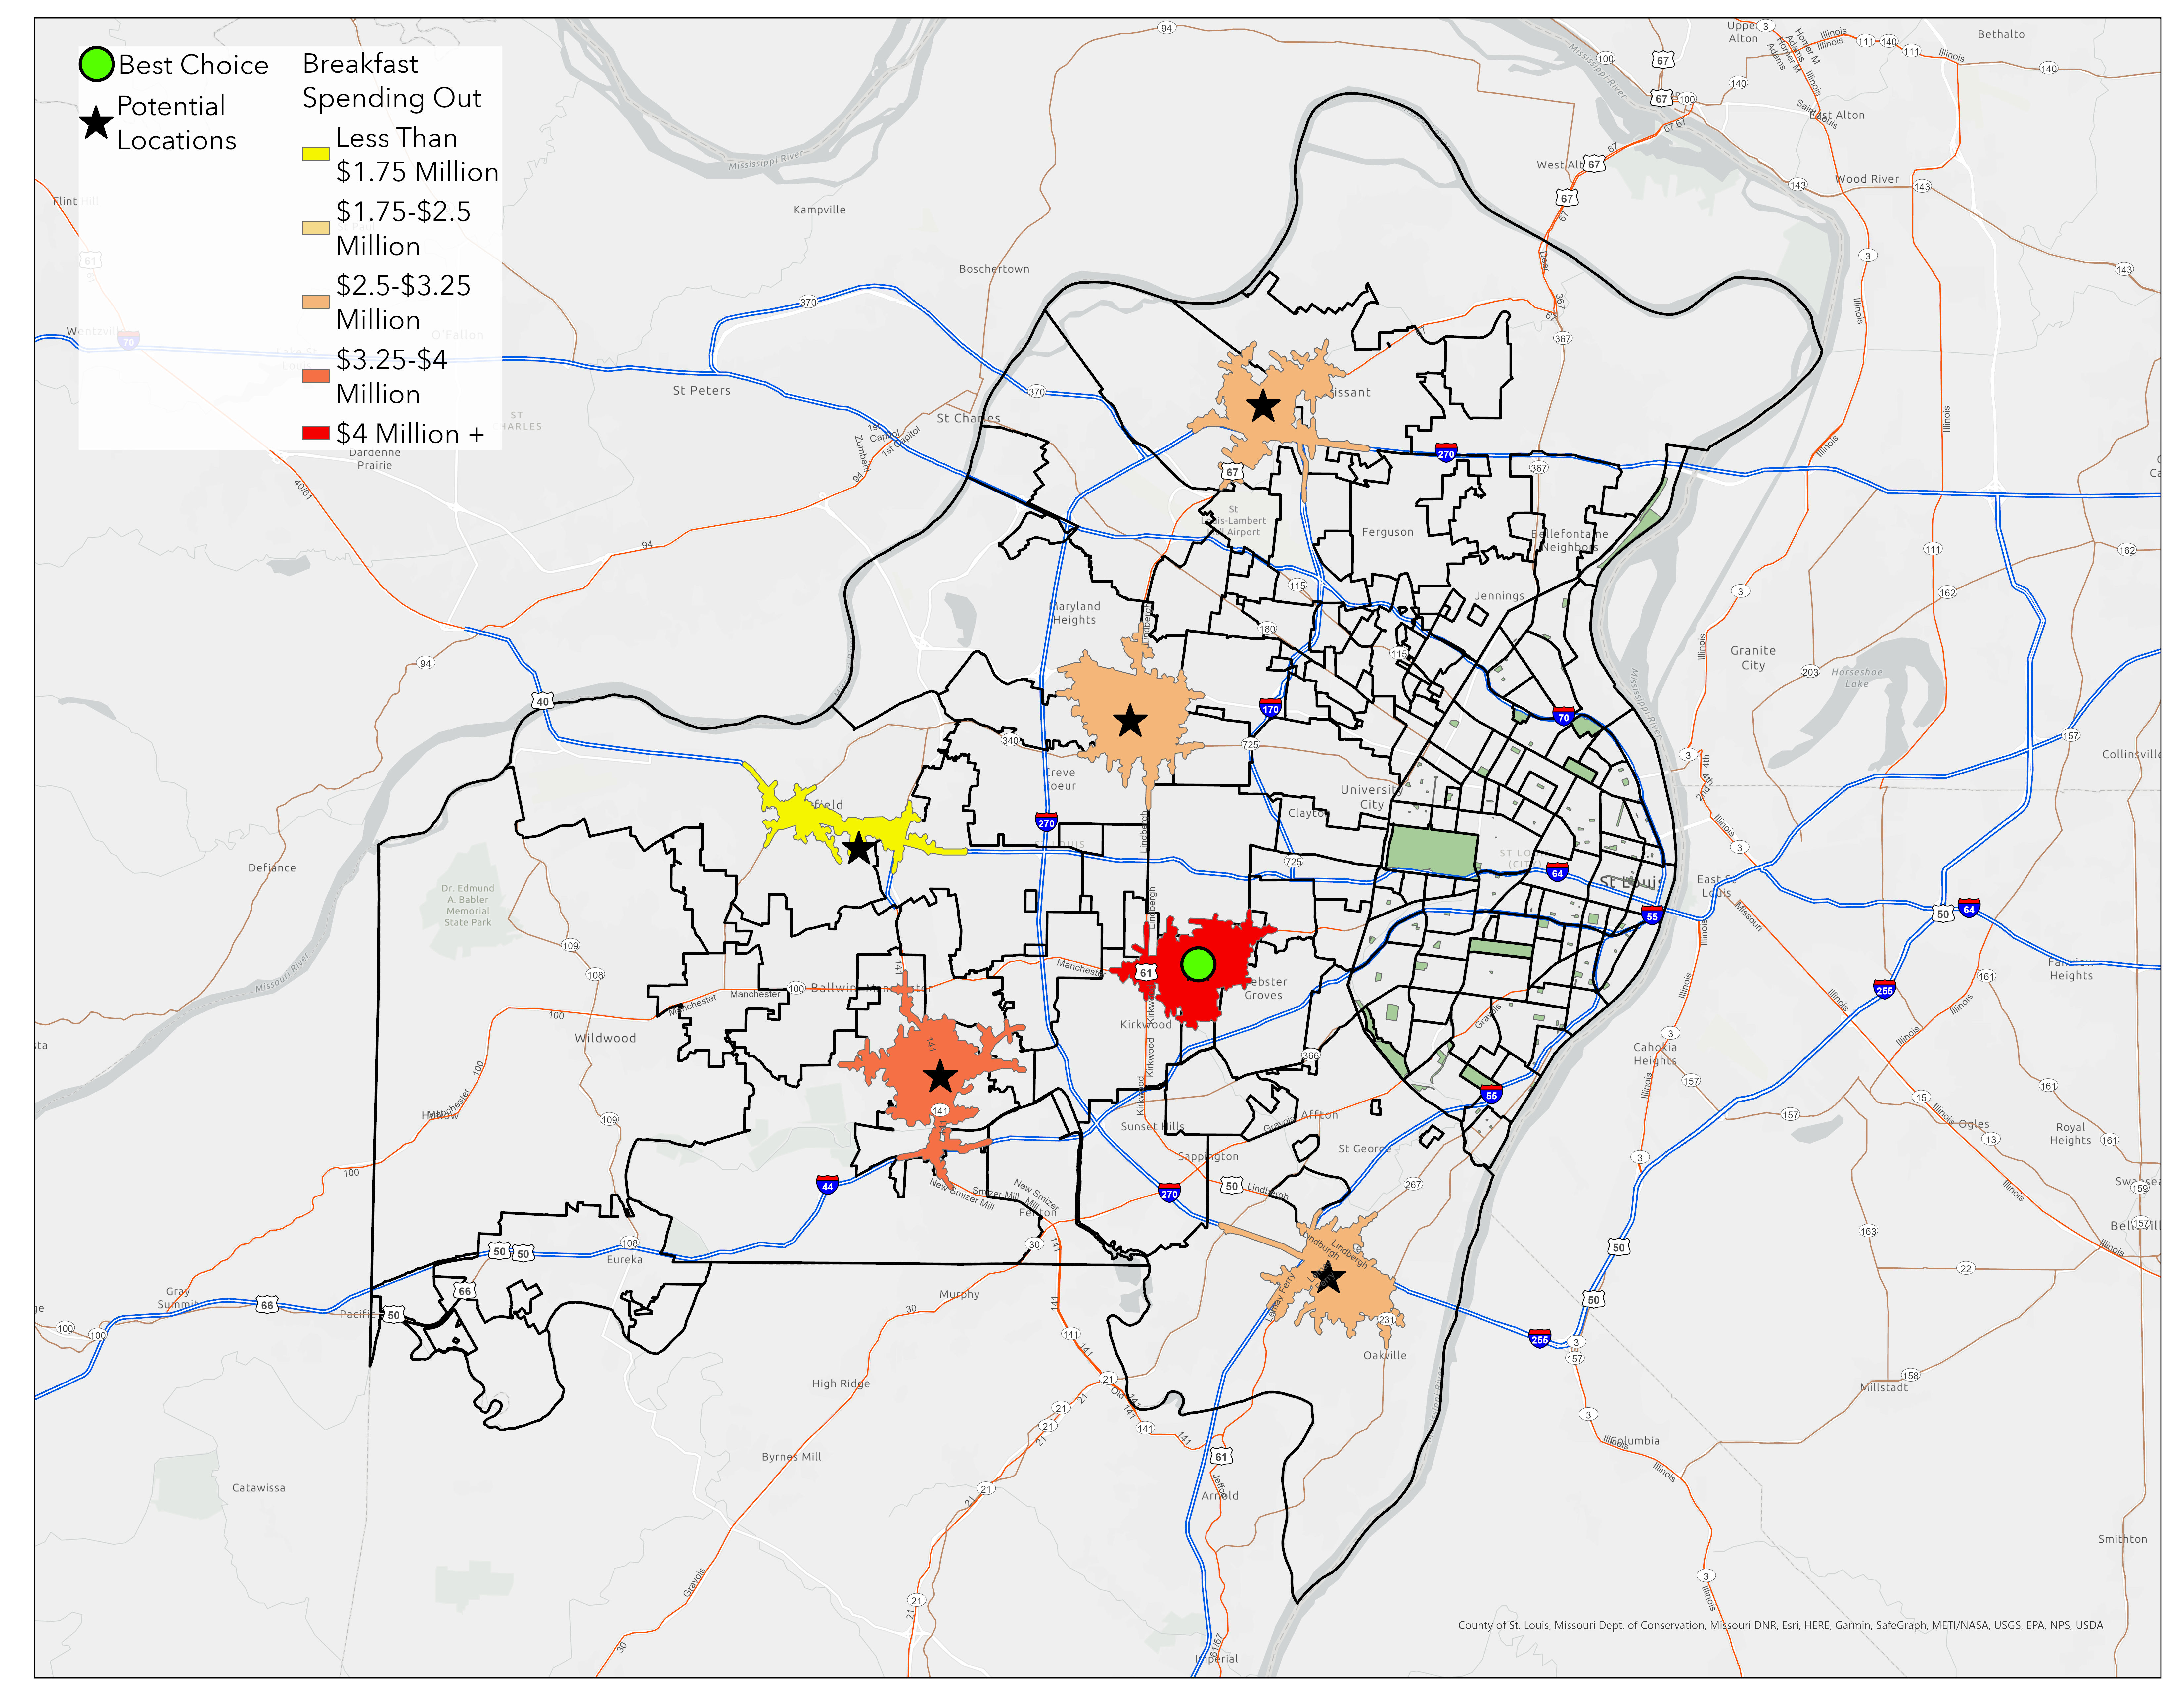
Figure 9: Spending on Breakfast-Out Within Potential Site Market Areas
Key Findings
Warson Woods market potential - nearly 5x higher than lowest option
Drive-time radius based on consumer research for optimal service areas
Competitor locations mapped and analyzed for market gaps
Target age range identified through customer base analysis
Business Impact & Conclusions
This methodology provides a much higher success rate than arbitrary location selection at relatively low cost. The analysis revealed:
- Clear winner: Warson Woods offers the highest market potential despite slightly older demographics
- Backup option: Valley Park provides ideal age demographics with strong market value
- Quantifiable decisions: Data-driven selection removes guesswork from expansion planning
- Scalable approach: Methodology can be applied to any retail location decision
Future Enhancements: The model could be improved with customer-level data on residence and work locations, transit path mapping, and more sophisticated market area calculations. However, even this simplified approach demonstrates the power of combining geospatial analysis with web scraping for business intelligence.
Yelp API Data Collection Script
Complete Python implementation for scraping competitor location data:
import requests
import numpy as np
import pandas as pd
import matplotlib.pyplot as plt
from YelpAPIKey import get_key
from copy import deepcopy

# Configure pandas display
pd.options.display.max_columns = 2000

# Define API Key, Endpoint, and Headers
API_KEY = get_key()
ENDPOINT = 'https://api.yelp.com/v3/businesses/search'
HEADERS = {'Authorization': f'bearer {API_KEY}'}

# Define search parameters
PARAMETERS = {
    'term': 'coffee',
    'limit': 50,
    'offset': 400,
    'location': 'Saint Louis'
}

# Collect all businesses with pagination
businesses = []
for offset in np.arange(0, 1000, 50):
    PARAMS = {
        'term': 'coffee',
        'limit': 50,
        'offset': offset,
        'location': 'Saint Louis'
    }
    response = requests.get(url=ENDPOINT, params=PARAMS, headers=HEADERS)
    data = response.json()

    for item in data.get('businesses'):
        businesses.append(item)

# Process categories (maximum 3 per business)
for business in businesses:
    if len(business.get('categories')) == 3:
        business["cat_1"] = business.get('categories')[0].get('alias')
        business["cat_2"] = business.get('categories')[1].get('alias')
        business["cat_3"] = business.get('categories')[2].get('alias')
    elif len(business.get('categories')) == 2:
        business["cat_1"] = business.get('categories')[0].get('alias')
        business["cat_2"] = business.get('categories')[1].get('alias')
        business["cat_3"] = 'None'
    else:  # length == 1
        business["cat_1"] = business.get('categories')[0].get('alias')
        business["cat_2"] = 'None'
        business["cat_3"] = 'None'

# Extract location and coordinate data
for business in businesses:
    business["street_address"] = business.get("location").get("address1")
    business["zip_code"] = business.get("location").get("zip_code")
    business['latitude'] = business.get('coordinates').get('latitude')
    business['longitude'] = business.get('coordinates').get('longitude')

# Convert to DataFrame and clean data
df = pd.DataFrame.from_dict(businesses)

# Remove unnecessary columns
drop_columns = [
    'id', 'alias', 'image_url', 'url', 'categories',
    'coordinates', 'transactions', 'location',
    'phone', 'display_phone', 'is_closed'
]
df.drop(labels=drop_columns, axis=1, inplace=True)

# Filter for coffee-related businesses
df_coffee = df.loc[
    (df["cat_1"].str.match('coffee')) |
    (df["cat_2"].str.match('coffee')) |
    (df["cat_3"].str.match('coffee'))
]

# Remove chain competitors (focus on independent shops)
df_coffee = df_coffee[df_coffee['name'] != "McDonald's"]
df_coffee = df_coffee[df_coffee['name'] != "7-Eleven"]
df_coffee = df_coffee[df_coffee['name'] != "Dunkin'"]

# Create cost categories from price indicators
df_coffee["cost"] = np.where(df_coffee["price"] == "$", 1,
                   np.where(df_coffee["price"] == "$$", 2,
                   np.where(df_coffee["price"] == "$$$", 3, np.nan)))

# Export cleaned data for ArcGIS Pro import
df_coffee.to_csv("yelp_stl_coffee_data.csv", index=False)

print(f"Data collection complete: {len(df_coffee)} independent coffeeshops identified")
print(f"Average rating: {df_coffee['rating'].mean():.2f}")
print(f"Price distribution: {df_coffee['cost'].value_counts().to_dict()}")
Data Processing Summary
The script processes Yelp API responses to:
- Handle pagination to collect comprehensive competitor data
- Parse business categories and extract coffee-related establishments
- Clean and standardize location data for GIS import
- Filter out chain competitors to focus on independent coffeeshops
- Create cost classifications for market analysis
Technical Skills Demonstrated
Geospatial Analysis
Service area modeling, spatial overlay analysis, market gap identification
Data Integration
Census demographics, commercial APIs, spatial data joining
Business Intelligence
Market analysis, competitor research, site optimization
Programming
Python web scraping, API integration, data processing pipelines