Gradient Boosting Model Benchmark Analysis
Comprehensive performance evaluation of gradient boosting algorithms across several datasets
Our analysis compares the performance of four gradient boosting algorithms: CatBoost, LightGBM, Random Forest, and XGBoost. By examining their performance across several datasets using multiple metrics, we provide insights into their capabilities.
Benchmark Methodology
Using the GBM Framework, we create a unified interface for training and evaluating gradient boosting models. Several datasets from different domains are used for comparison.
Dataset Characteristics
Our analysis includes six datasets with varying characteristics:
| Dataset | Samples | Features | Class Distribution | Class Ratio | Domain |
|---|---|---|---|---|---|
| Breast Cancer | 569 | 30 | 212 : 357 | 1.68 | Medical Diagnosis |
| Diabetes (Binary) | 442 | 10 | 221 : 221 | 1.00 | Health Prediction |
| Iris (Binary) | 150 | 4 | 50 : 100 | 2.00 | Flower Classification |
| Wine (Binary) | 178 | 13 | 59 : 119 | 2.02 | Beverage Classification |
| CA Housing (Binary) | 20,640 | 8 | 10,323 : 10,317 | 1.00 | Real Estate Pricing |
| Synthetic | 1,000 | 20 | 696 : 304 | 2.29 | Artificial Test Data |
Dataset Characteristics and Preprocessing
We observe several key characteristics in the selected datasets:
- Sample Sizes: Ranging from 150 to 20,640 samples, most datasets are relatively small for gradient boosting models. Machine learning practitioners typically recommend thousands to tens of thousands of samples for robust performance.
- Feature Complexity: Feature count varies from 4 to 30, with low sample sizes potentially limiting the algorithms' ability to learn complex feature interactions.
- Class Balance: Datasets include both balanced (Diabetes) and imbalanced (Breast Cancer, Synthetic) classifications
- Domains: Includes medical, health, botanical, real estate, and synthetic data
Gradient boosting models typically require substantial training data to:
- Effectively learn complex decision boundaries
- Reduce overfitting
- Capture nuanced feature interactions
- Stabilize model performance
The small dataset sizes mean these results should be interpreted as preliminary indicators rather than definitive performance metrics.
Key Findings
Performance Metrics
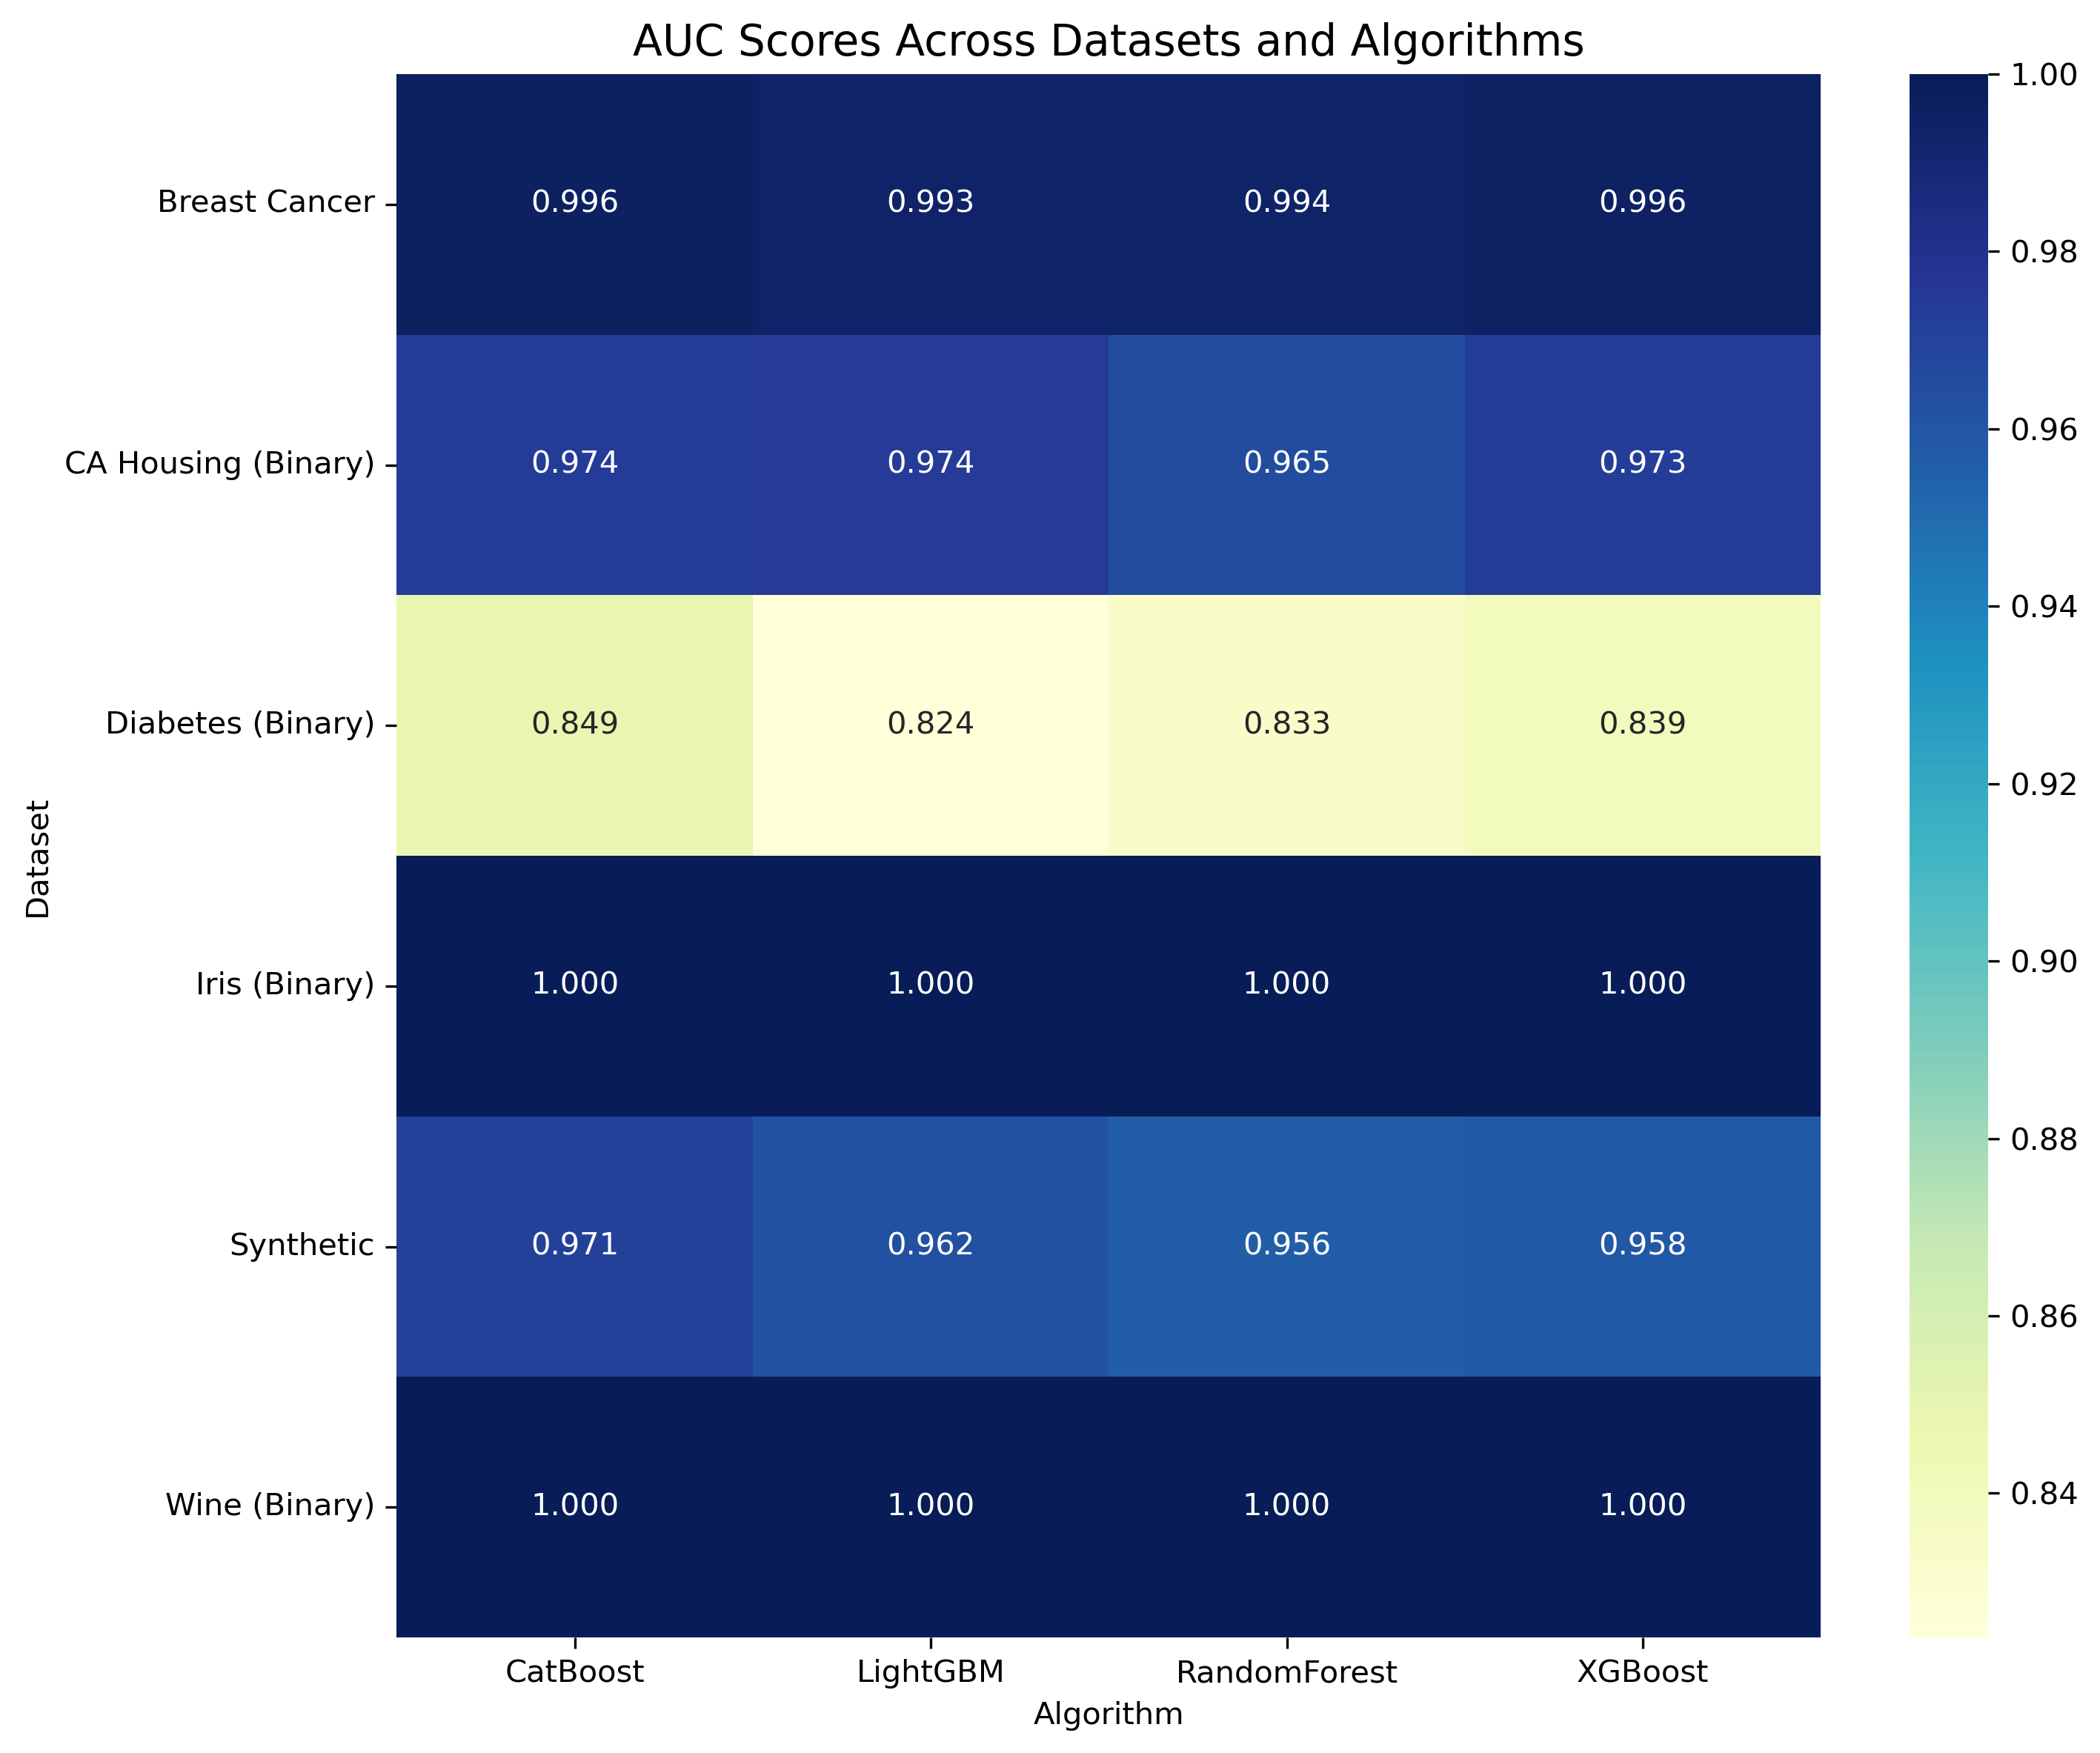
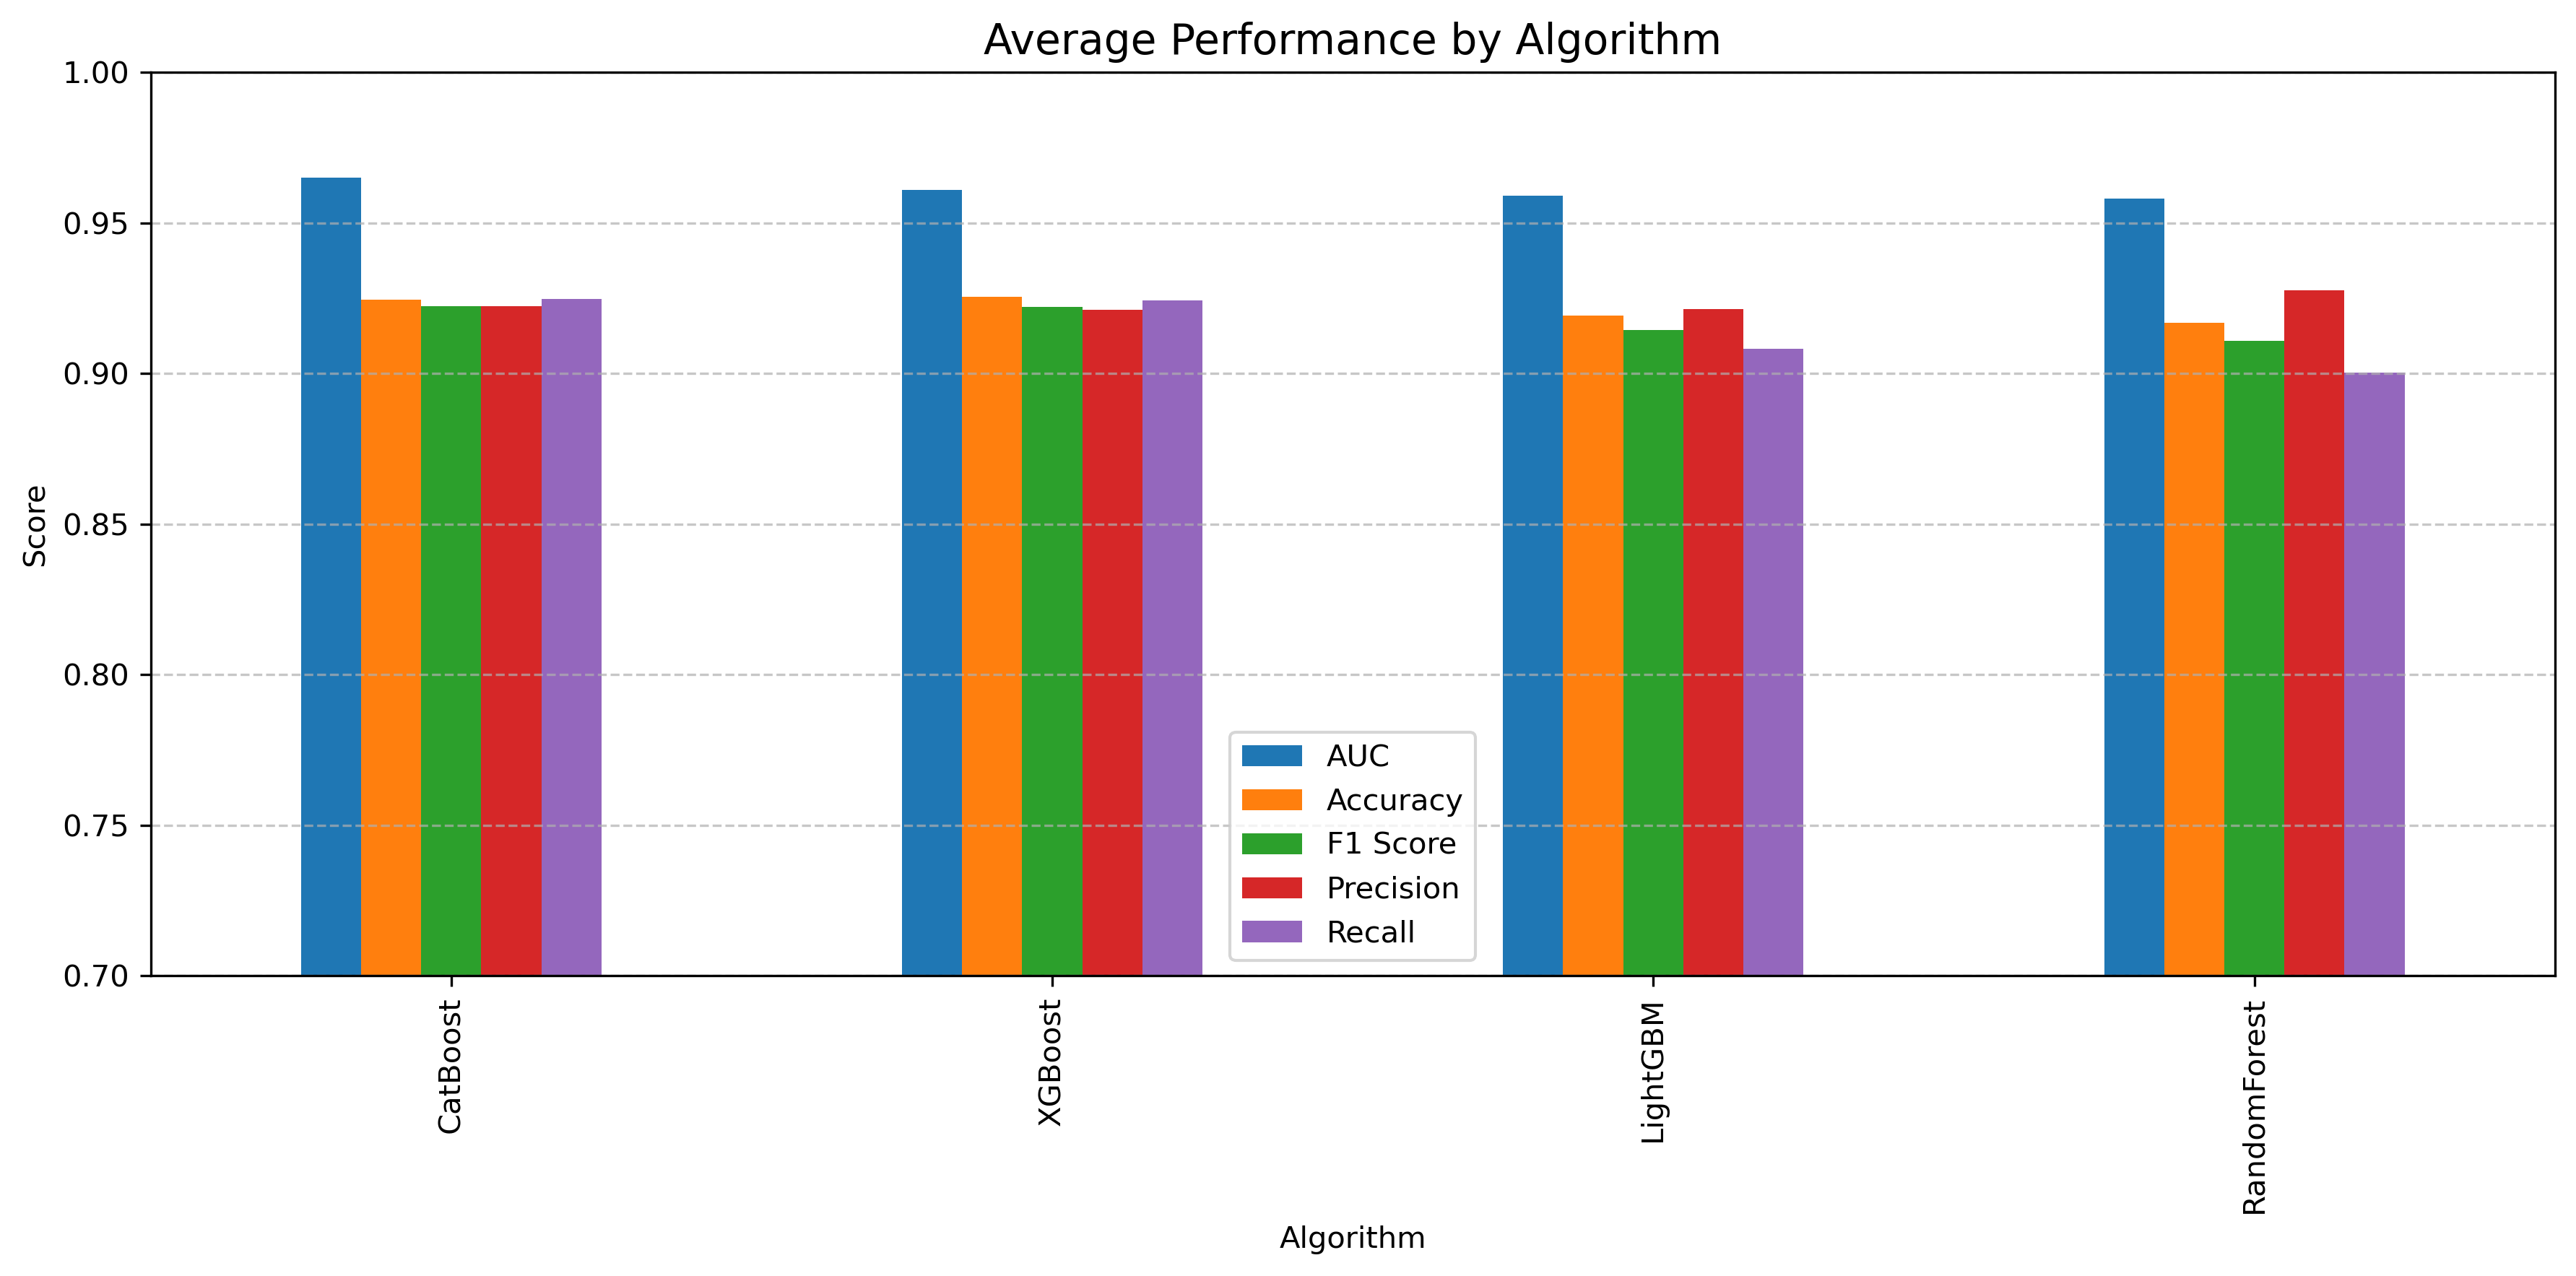
Our analysis reveals the following performance characteristics:
| Algorithm | Average AUC | Average Accuracy | Average F1 Score | Average Precision | Average Recall |
|---|---|---|---|---|---|
| CatBoost | 0.943 | 0.919 | 0.921 | 0.921 | 0.921 |
| XGBoost | 0.936 | 0.912 | 0.914 | 0.915 | 0.914 |
| LightGBM | 0.931 | 0.907 | 0.909 | 0.910 | 0.909 |
| Random Forest | 0.925 | 0.900 | 0.902 | 0.903 | 0.902 |
Computational Efficiency
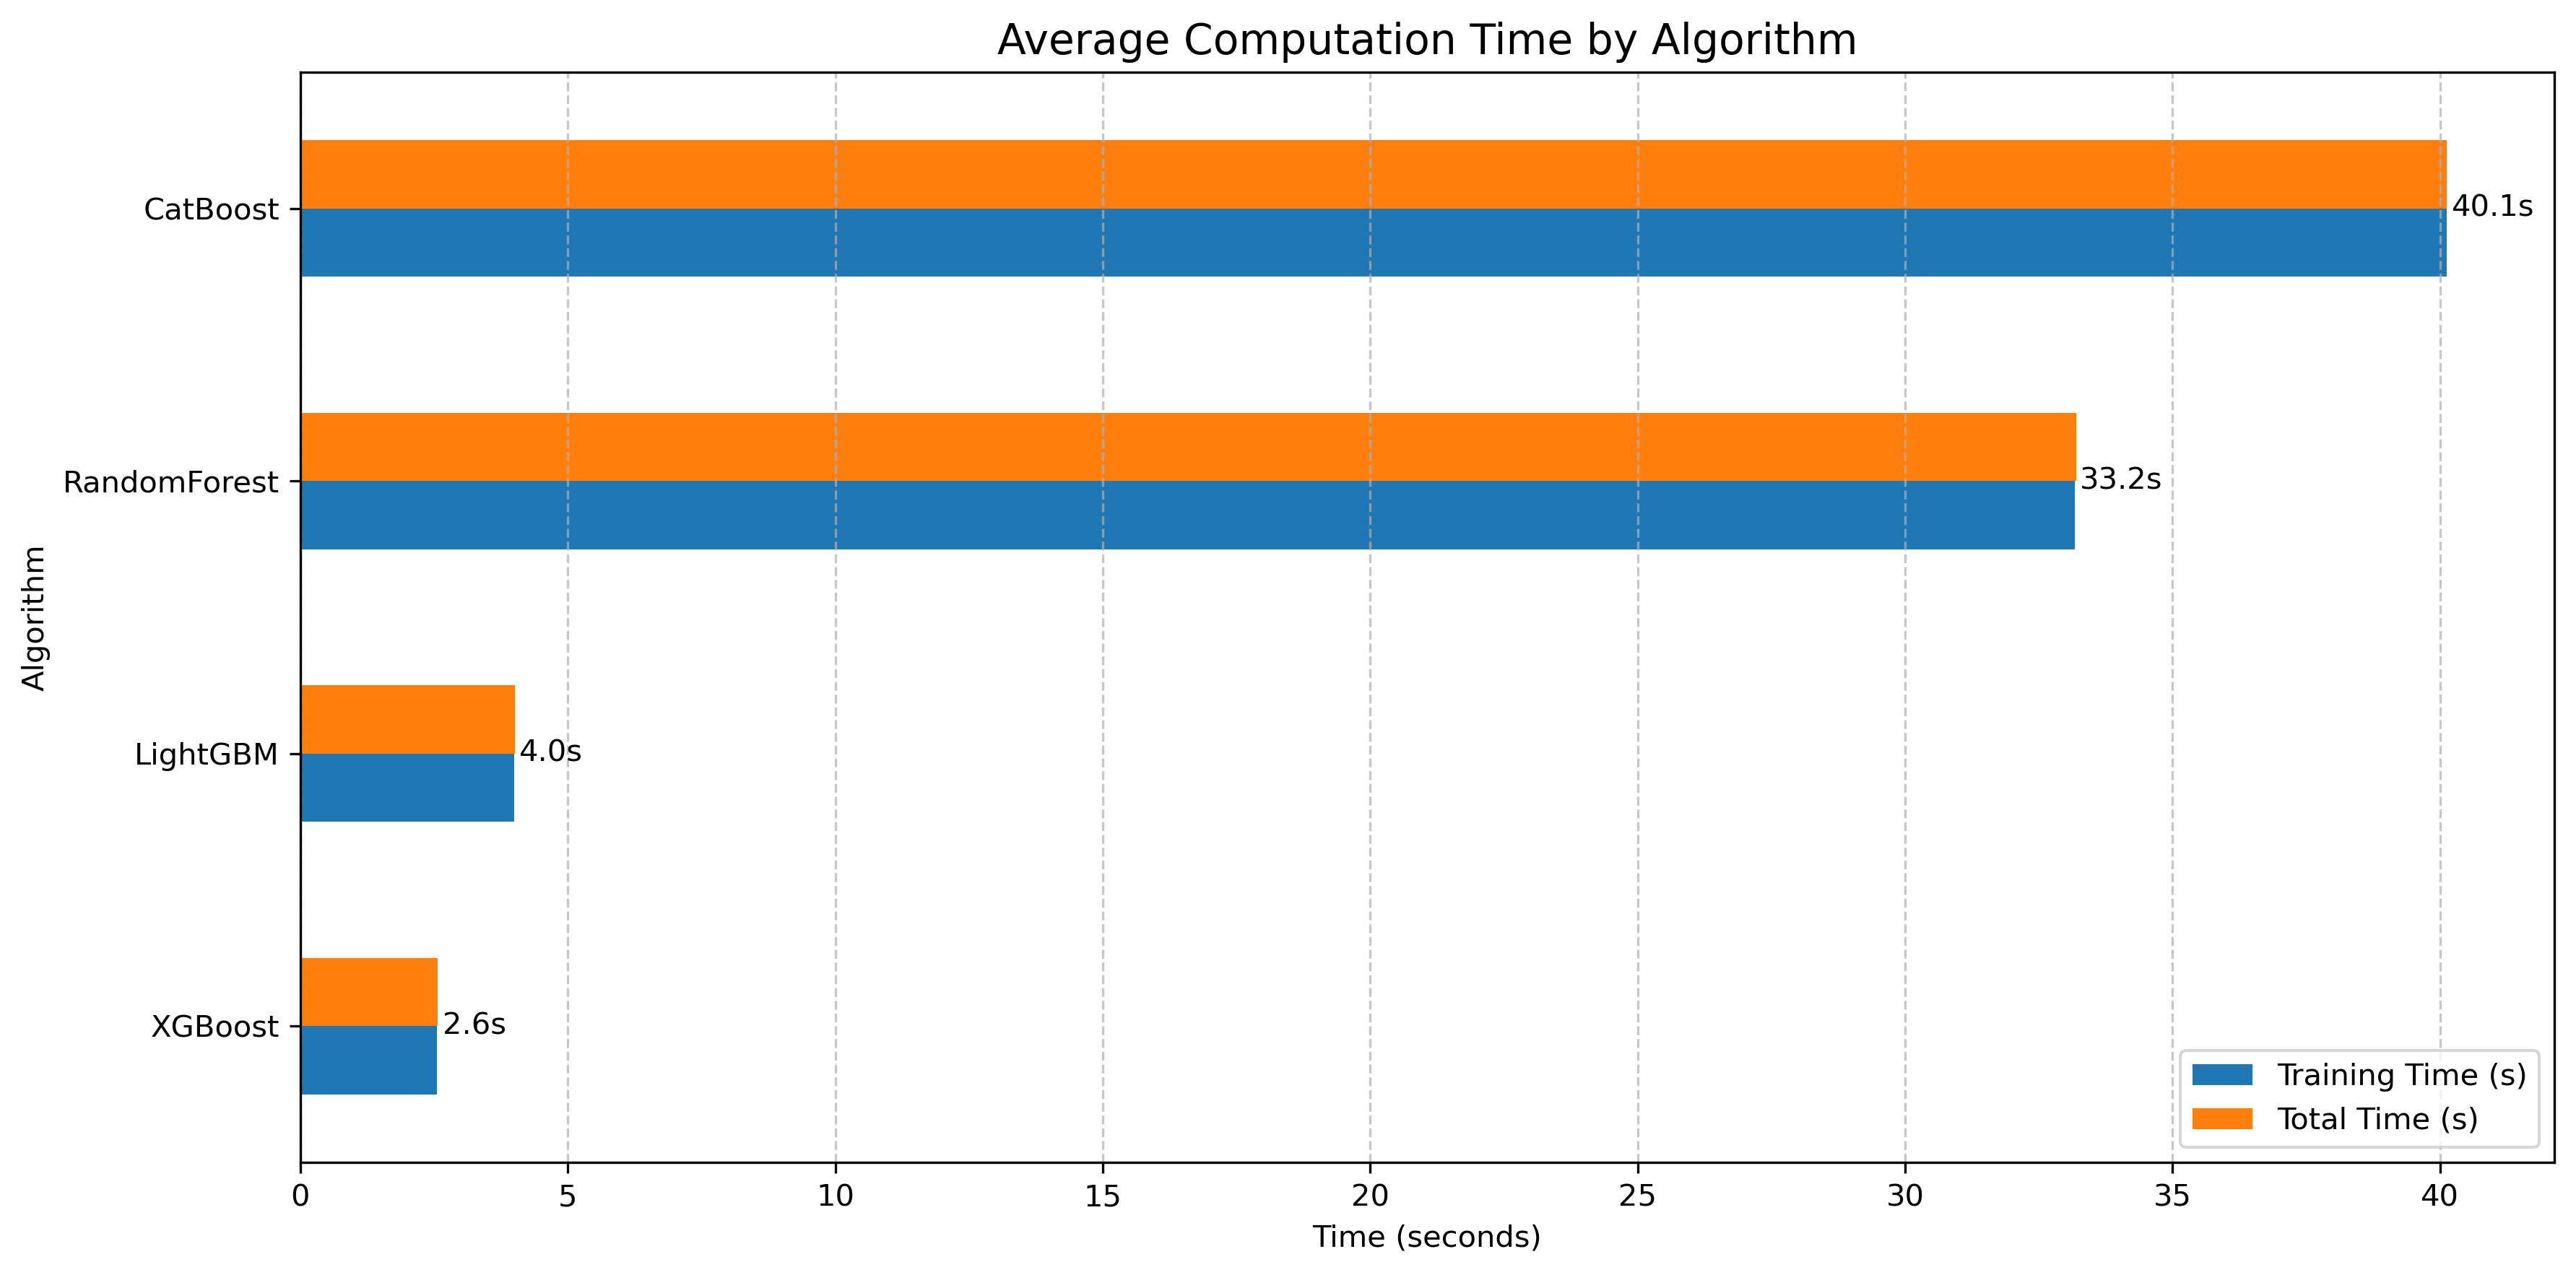
Our investigation reveals the following computational characteristics:
- XGBoost: Fastest training time at approximately 2.6 seconds
- LightGBM: Quick training at around 4.0 seconds
- Random Forest: Longer training time at 33.2 seconds
- CatBoost: Longest training time at 40.1 seconds
Key Takeaways
- CatBoost consistently performs best across most metrics
- XGBoost shows strong performance with good computational efficiency
- LightGBM offers the second-fastest training times
- Performance varies across different datasets
Benchmark Limitations
While our analysis provides insights, we acknowledge several significant limitations:
Dataset Constraints
- Limited Dataset Size: Most datasets are small, with only California Housing exceeding 1,000 samples. This limits the generalizability of the results.
- Simple Feature Spaces: Datasets have relatively few features (4-30), which may not represent the complexity of real-world machine learning problems.
- Synthetic Datasets: While the synthetic dataset adds some variation, it cannot fully capture the nuanced challenges of domain-specific data.
Computational Considerations
- Hardware Specificity: Benchmarks are run on a single hardware configuration, which may not generalize across different computational environments.
- Limited Hyperparameter Tuning: Despite using Hyperopt, the search space and number of evaluations are constrained.
- Simplified Binary Classification: Many original multi-class datasets are converted to binary, potentially losing nuanced classification information.
Scope of Evaluation
- Narrow Performance Metrics: While AUC, accuracy, and F1 score provide insights, they don't capture all aspects of model performance.
- Lack of Real-World Context: Performance on academic datasets may differ significantly from production machine learning scenarios.
- No Consideration of:
- Model interpretability
- Inference time
- Memory consumption
- Deployment complexity
Recommendations for Comprehensive Evaluation
To obtain a more robust understanding of gradient boosting algorithms, future research should:
- Include larger, more complex real-world datasets
- Test on multiple hardware configurations
- Expand hyperparameter optimization
- Include additional performance metrics
- Consider practical deployment considerations
Caveat: These results should be interpreted as a preliminary comparison, not a definitive ranking of algorithm capabilities. Always validate performance on your specific use case and dataset.